15.2 Review of changes since last edition and current trends#
15.2.1 User expectations for IT services in an NSO#
It is a question of survival for NSOs the world over to modernise their statistical information systems in order that official statistics can stay relevant amid competition from other data sources, increasing demands from users and stakeholders combined with financial constraints.
NSOs are under constant pressure to do more with less in a continued climate of financial constraint. The levels of expectations from users are rising from all levels of government, policymakers, civil society, academia, research bodies and the general public – who demand high-quality statistics ever more rapidly – today’s users expect data immediately and are no longer prepared to wait weeks or months for information to be made available by an NSO. In addition, an NSO is expected to access and make use of new sources of data, adding value and statistical know-how before making them available. Users now expect easy access on all platforms, telephones and tablets as well as via computers. Traditional users of official statistics expect secure, high performance, stable and modern applications to deliver data to meet the needs of decision-makers – and this is especially important in the context of the SDGs. The recent generation of millennials and digital natives expect immediate free access to data and interactive visualisations.
NSOs are now also in competition from other non-official providers of data - data is no longer the monopoly of the NSO – and users are no longer willing to wait months for official data to be released when unofficial alternative without the same constraints of ensuring quality can be available much more quickly.
15.2.2 Changes in the way of working#
Collaboration between organizations
In this time of constant change, an agile and adaptive approach to working is needed. One way in which NSOs have responded to deal with these challenges and increased expectations is to work together to solve common problems.
Recent years have seen an increase in collaboration between organizations working on projects and sharing software having recognised the need to work together to modernise statistical systems, standardise processes and industrialise statistics production in the face of shrinking budgets so as to stay relevant in the face of alternative non-official sources of information. The model of developing in isolation is inefficient and obsolete: the future is in collaborating.
At the time of the last handbook, there were only a handful of collaborative projects between NSOs and International Organizations – today, this way of working is becoming mainstream. There are different modes of collaboration: An NSO can share its own software with other organizations, they can reuse existing software made available by another organization, or they can collaborate together with one or more other NSOs to develop tools for their common use that can then, in turn, be made available to others in the statistical community.
Recent years have seen the formation of international groups and communities to facilitate this process and organizations are now collaborating within formal frameworks. Such collaborations are not only a very important development for an NSO in saving costs, but it also sends a positive message to stakeholders that they are getting value for money by not wasting resources reinventing the wheel.
Working collaboratively does require investment, it can be complex, and staff will need to adapt to new ways of working and new methods of project management, but it is the most efficient way of working for an NSO in the long run.
Reusing software
An NSO should always seek to gain advantage of the tools available from the international statistics community rather than develop software for their own use.
The move is away from in-house development towards collaboration and the first instinct of the NSO when there is a need to upgrade their processes should be to inspect the various inventories of software maintained by international and regional bodies such as the High-Level Group for the Modernisation of Official Statistics (HLG-MOS), the Common Statistical Production Architecture (CSPA), the Statistical Information System Collaboration Community (SIS-CC) and the Statistical Data and Metadata Exchange (SDMX) Toolkit.
Regional agencies have an important role to play in offering guidance and impartial advice on which tools would best meet the requirements of the NSO and to act as centres of expertise and training. This is of particular importance for countries with low capacity and limited infrastructure in order to avoid being overburdened with software from specialist agencies that does not meet precise needs and is complex to maintain.
This is especially relevant in the context of the SDG and the urgent need to provide indicators on development goals in a timely manner using standard interchangeable format. Common tools encourage the use of standards such as SDMX for improving data exchange processes.
If, however, an NSO does need to develop a specific software tool in the future, it should be developed with a view to future reuse by other organizations according to CSPA principles of being component-based and ‘plug and play’ ready.
The UNECE High-Level Group for the Modernisation of Official Statistics (HLG-MOS) is a group of chief statisticians discussing the modernisation of statistical organizations. Their mission is to work collaboratively to identify trends, threats, and opportunities in modernising statistical organizations. Modernisation groups cover Supporting Standards, Sharing Tools, Organizational Resilience and “Blue Skies Thinking” Network.
The OECD Statistical Information System Collaboration Community (SIS-CC) is a community of dissemination software (“.Stat”) users which was set up so that participating members could benefit from a broad collaboration, sharing experiences, knowledge and best practices, and to enable cost-effective innovation.
15.2.3 Increase in use of web#
Implications for an NSO of increased internet use
The massive increase in access to and use of the internet has, of course, had a huge impact on the NSO.
Since the publication of the last handbook in 2003, internet usage has increased from 608 million users to over 4.2 billion at the time of writing.
This figure is expected to rise further in the years to come as coverage expands even further and costs of access continue to drop. This obviously has had and will continue to have, a profound effect on the way statistics are accessed. Access to data via the internet has evolved from basic static pdf downloads through to interactive browsers and machine-to-machine connections. The internet affects how an NSO communicates, especially via social media and increased usage, in turn, raises the bar for expectations. The internet permits the merging of data sources between official statistics and other data sources to produce ‘mashups’ whose content are not in the control of an NSO. This is both an opportunity and a challenge as while it can increase access to data, it also carries the risk of data being misused for political or other purposes.
The ‘Internet of Things’
In addition to the vast increase in the use of the web, the “Internet of Things” (IoT) is emerging as one of the next technology mega-trends. IoT consists of the networked connection of billions of devices to the internet covering such diverse objects as household appliances, motor vehicles, planes and industrial equipment. By connecting these devices to the Internet, they generate further huge quantities of data available for analysing how we live.
The number of networked devices was 8.4 billion in 2017, and it is estimated to reach 30 billion objects by 2020.
In this way, IoT will open up new opportunities (and challenges) for additional data sources for an NSO as it integrates the physical world into new data sources. Tools for analysing IoT data sets are already available via commercial service providers such as Amazon Web Services.
There are both opportunities and challenges for an NSO as to how it can most effectively access and utilise this data. It could have an impact in the future on data collection and offer the possibility of real-time data on a number of sectors such as energy use, transportation, household consumption and industrial output.
The challenges posed will be the same as those for other Big Data (see Chapter 9.5 — Big Data) sources on how an NSO should adapt to new technologies required to store and use this data, how to gain access to this data, to integrate and mix it with traditional official data sources to compile new products.
An article “The Internet of Things Explained: Making sense of the next mega-trend” (🔗) providing an explanation and facts and figures concerning the IoT.
15.2.4 Cloud technology#
Increase in use of cloud technology
The “Cloud” is another growing web-based technology trend.
Cloud technology is computing power made available as a utility that can be tapped on demand. In this way, services such as servers, storage, and application software are delivered to a user via the internet enabling rapid access to shared networks of system resources.
Cloud computing barely existed as a service at the time of the last handbook. Its use was initially driven by the private sector, but it is now making significant inroads in NSOs. There, it is widely used for storage and communication such as web-based email and calendars and the sharing of documents. The next phase will be to use Software as a Service (SaaS) for data processing and Big Data analytics.
Pros and cons of cloud technology for an NSO
Cloud computing offers solutions to an NSO irrespective of capacity level but is especially useful for allowing countries with weak infrastructure to access more advanced computing technology. As the cloud requires only reliable internet access, it can eliminate high upfront costs of installing hardware and software infrastructure and reduce the resources needed for ongoing maintenance.
Cloud technology is scalable and can enable IT teams to more rapidly tailor resources to meet fluctuating and unpredictable demand and can remove the layers of complexity in setting up infrastructure. It can enable the sharing of software as applications can be saved on the cloud by one organization and used by other NSOs as needed.
The inherent security capabilities of large-scale Cloud computing services can guarantee a higher level of security for some lower capacity NSOs than their own infrastructure.
For some NSOs problems could be related to confidentiality as data on citizens is not stored on-site, which may go against the national legislation.
An article from the Statista Statistics portal “Cloud Computing - Statistics & Facts” (🔗).
Examples of local governments using cloud computing (🔗).
An example from the OECD Statistical Information System Collaboration Community (SIS-CC) where cloud computing is proposed as a solution for countries with weak infrastructure (🔗).
15.2.5 Smartphones and tablets#
Increase in use of smartphones and tablets
The most visible and unavoidable technology trend in recent years has been the massive increase in the use of smartphones and tablets. The ubiquity of these devices has had an impact on the NSO as in every other aspect of modern life. Smartphones have advanced computing capabilities and connectivity, and at the time of writing over a third of the world’s population is projected to own a smartphone, an estimated total of almost 2.5 billion.
Implications for an NSO of smartphones and tablets
Due to the increasing functionalities and decreasing costs of mobile phones, they have been employed in a variety of ways by NSOs for both data collection and dissemination throughout the world.
Data collection using these devices can improve the quality of data by incorporating editing and validation rules in phone apps. The timeliness can be also be improved as data can be used to update a central database in real-time via the device if there is sufficient network coverage. If there is no coverage in a remote area, data can be stored on the device and used to update the database later.
Smartphones can have interactive survey questions sent directly to respondents to input and transmit data in structured ways. Simpler basic low-end ‘dumbphones can use simple text messaging or voice to send out short queries by phone to a list of phone numbers, prompting users to reply with a short response.
For an NSO, the use of smartphones in data collection has the advantages of increased speed of data transmission, higher quality and accuracy. It also allows for the inclusion of additional geolocation information and images.
UN Global Pulse and MobileActive.org inventory of mobile phone-based data collection projects (🔗).
UN Big Data, Task Team on Mobile Phone Data (🔗).
15.2.6 Data visualisation software#
The importance of data visualisation
Visualisation tools play a key role in making complex data understandable and accessible to a wide audience. It can support and underscore messages to influence policy and evidence-based decision making. Visualisations can also reveal compelling stories from complex underlying data and have become an important element of communication strategies. Data visualisations increase users’ knowledge of statistics to help make better decisions – and easily understandable statistics are a public good - which will help ensure that data is being used more often, thereby increasing their value.
As with other technology fields, there has been an explosion in data visualisation technology and used in recent years. Until fairly recently data visualisations used by NSOs were mainly static images and simple graphics; advances in technology have led to a wide range of visualisation methods and sophisticated graphics that border on artistic design that can be reused, linked to datasets and embedded in websites and via apps in social media.
Good visualisations capture users’ attention. This is a scarce commodity, and there is intense competition for this attention from information from many other sources. Data visualisation has a role in data analysis for finding patterns and correlations in different data sources, in particular in the spheres of Big Data analytics and data science.
Data visualisation brings together the skills of statisticians, analysts, IT experts, graphic designers and psychologists into one single domain. There is a challenge to recruit staff of the correct profile to undertake this kind of work. While there are expanding options for data visualization tools that do not require specialization, it is important that NSOs identify the technical and human constraints for their identified visualization objectives.
Types of data visualisation
A number of tools are available for an NSO to visualise data. The most basic type is a simple chart derived from data and includes all the standard graphics such as line charts, bar charts, pie charts, scatter plots, etc. These can be generated from the data using office software such as Excel and then saved as static images to be posted in a document or website.
Other tools allow data to be dynamically linked to visualisations on a web site using third party graphical plug-ins. Using this method, an end-user can create and save their own visualisations that will also show the latest available data according to their own specifications.
Pre-prepared animated graphics can be used as ‘storytelling’ devices. In this way, a set of data can be used to illustrate a phenomenon with the graphic moving over a timeline accompanied by text describing events at each stage. These graphics can be used to explain complex topics in a visually appealing and more easily understandable way for wider audiences.
Interactive visualisations allow users to enter their own data into an online graphic to observe different scenarios or add their own criteria.
The increase in use of data visualisations by NSOs
Today, almost all NSOs use data visualisations on their websites or included in phone apps. They are often the most appealing part of a web site and can improve an NSO’s communication with users. Data visualizations are essential for understanding and accessibility of complex data for a broad audience. They can be particularly appealing to the younger audience in the form of interactive visualisations that have an educative role, or for storytelling purposes.
Data Visualization Principles and Best Practices
When deciding how to offer data and information to audiences, visual formats tend to engage audiences more effectively when compared to just numbers and text. With half of the human brain devoted directly or indirectly to vision[1] and the ability to process an image in just 13 milliseconds[2], providing complex information and data visually can help audiences better grasp the data and stories behind the numbers.
As statisticians and data analysts, this creates an opportunity to tell compelling stories with the data so that the information created has an impact and offers insight. Overall, the goal remains to provide audiences with accurate, insightful data and information in a way they can understand and connect with- where they can see themselves in the data. Visualization should therefore be grounded in ensuring it does not mislead the audience and that the data and information provided is accurate and truthful. To do this, it is important to:
Be clear on the who, what, why of the data by exploring the data to understand different facets and facts.
Identify and understand the target audience and their statistical literacy, keeping things simple and understandable.
Understand, develop and articulate the key messages from the data.
Identify visualization objectives, technical and human constraints, style guidelines and preferred visualization tools.
Effective data visualization, where audiences can easily digest the messages and relationships in the data, can be developed in myriad ways. Still, the following best practice steps are helpful when getting started:
Explore and understand the data: This process begins by tidying or cleaning the data to explore it easily and identify anomalies or inaccuracies. Exploring the data leads to discovering trends, changes over time, patterns and correlations, etc., and helps identify the facts that should be highlighted in the data. This exploration helps to clarify the ‘what’, so that the data visualization and storytelling can provide the ‘why’ and the ‘so- what’.
Understand your audience: NSOs have a broad audience for the dissemination of statistics, ranging from the general public, government agencies, policymakers, academia and other stakeholders as well as the media[3]. It is essential to understand the target audience for the data visualization, along with their statistical literacy and their information needs to tailor the information accordingly.
Develop key messages: The most challenging aspect of developing good data visualization is creating key messages from the data– the main points or context you want the audience to hear, understand and remember. These messages should be data-driven and evidence-based as well as clear, concise and tailored to your audience. They also aim to provide essential information and show the meaning of the data.
Choose the best visuals: More is not necessarily better for visuals in data visualization, and finding the best chart or graph is very context-specific. It is important to strike a balance between simplicity and not losing the story behind the data. Luckily, many different chart and graph types can help to highlight the facts, key messages and context in the data.
Charts: depending on what message or data should be highlighted, choosing a chart depends on many different factors. See: Chart Chooser (🔗); Data to Viz (🔗); One Chart at a Time video series (🔗).
Icons: often used for infographics, icons communicate information without the need for words and are a strong tool for conveying messages and grabbing users’ attention. See: UNSD SDG & COVID-19 Data Visualization Toolkit (icons) (🔗).
Colours: used to help differentiate and represent information, colour palettes and combinations should also be considered in any data visualization. See: Overview articles (1) and (2); Adobe Color (🔗); Data Color Picker (🔗).
Clean design (labels, visual hierarchy): follow a visual hierarchy and ensure titles, labels, axis, etc. are clear, correct and take the guesswork out for the user.
Get feedback and review/revise: sharing the data visualization with colleagues and even testing it with your target audience can help to ensure it clearly conveys the data and data story in a concise and understandable way.
United Nations Economic Commission for Europe (UNECE) guidelines part 1 and part 2 or using data visualisation to make data more meaningful.
Environmental Systems Research Institute (ESRI) geographic information system (GIS) software visualisations (🔗).
UK Office for National Statistics (ONS) data visualisation guidelines for creating charts and tables (🔗).
Statistics Netherlands (CBS) guidelines for data visualisation (🔗).
Top 10 Data Visualization Best Practices (visme.co).
Chartio: 5 Data Visualization Best Practices: The Secrets Behind Easily Digestible Visualizations.
GoodData: 5 Data Visualization Best Practices.
Data Visualization – Best Practices and Foundations (🔗).
Data visualization: basic principles (🔗).
15.2.7 Big Data#
The growth of Big Data
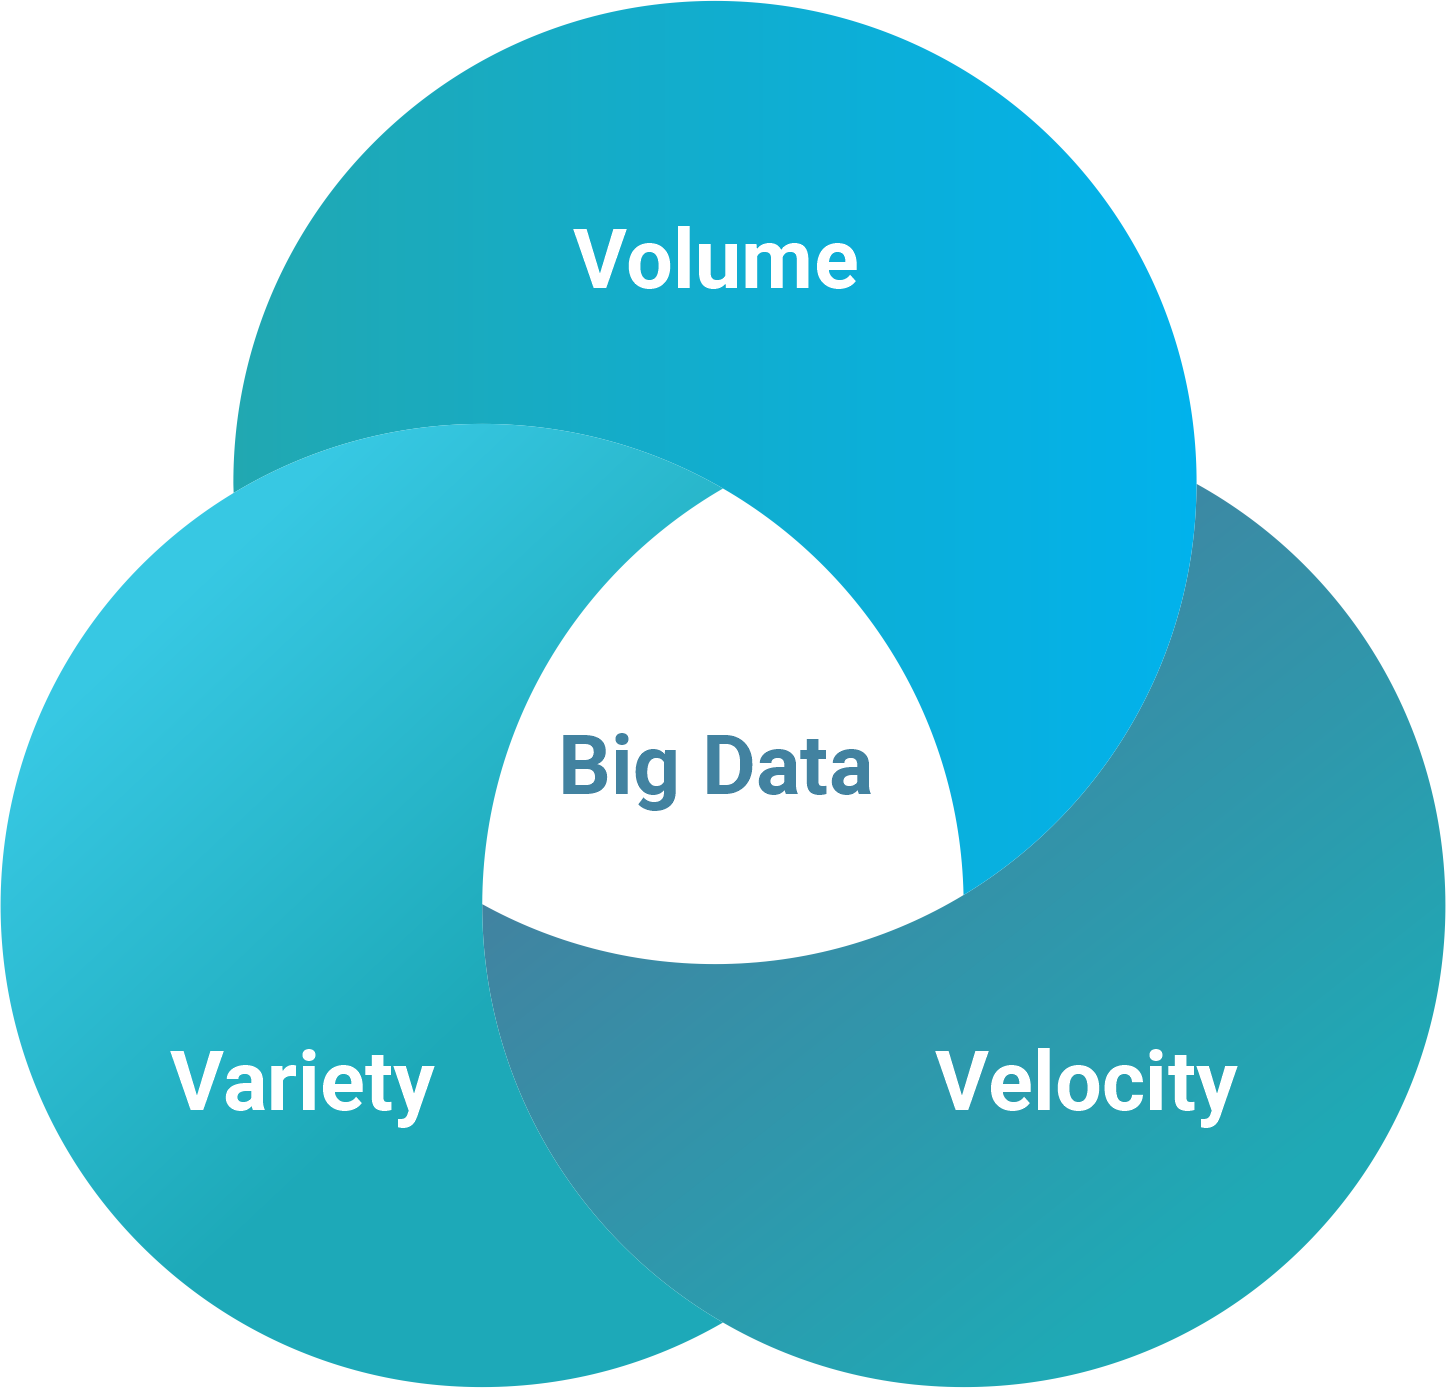
The term Big Data was coined in recent years - the term has several definitions but refers in general to the huge proliferation of data generated by business transactions, social media, phone logs, communication devices, web scraping, sensors etc. Perhaps the most well-known definition of Big Data is data of “increasing volume, velocity and variety”.
Big data is often unstructured as such data sources have no pre-defined data model and often does not fit well into conventional relational databases.
A huge amount of hype has been generated around the topic which has generated pressure on the NSO to use Big Data to create new products and to complement or replace existing data outputs at low cost and in a more timely manner, particularly in the context of the so-called “Data Revolution” for using new data sources to fill some of the most critical data gaps, particularly in development.
Despite the high expectations for using Big Data, the reality is currently proving to be that while the technology needed to process these huge data sets is available and maturing, the biggest obstacle for an NSO is to actually gain access to the data. This lack of access can be due to reluctance of a business to release their data, legal obstacles or concerns about privacy (see also Chapter 9.5 — Big Data).
Implications of Big Data for an NSO IT infrastructure and skill requirements
At the time of writing, there are very few cases of using Big Data in NSO production processes apart from geolocation data. This type of data has the advantage of being both relatively simple to access and also structured in a standardised way that allows integration with traditional datasets to provide additional and more granular information on location.
There has been much discussion on what the position of an NSO should be vis-à-vis Big Data – scenarios include the NSO developing a role as a ‘broker’ of Big Data which has been integrated by a third party, or simply providing a stamp of official quality to such datasets once they have validated its content and methodologies.
In order to make use of Big Data, an NSO will require access to High-Performance Computing resources and staff with new skills. The processing of increasingly high-volume data sets for official statistics requires staff with statistical skills and an analytical mindset, strong IT skills and a nose for extracting valuable new insights from data – often referred to as “Data miners” or “Data scientists” (see Chapter 15.2.16 — Data science).
An NSO needs to develop these new analytical capabilities through specialised training. Skills will include how to adapt existing systems to integrate Big Data into existing datasets and processes (ref para.) using specific technology skills as Massively Parallel Processing (MPP), Hadoop, R, Elastic Map Reduce, Visualisation methods and text mining.
UNECE Guidelines for the establishment and use of partnerships in Big Data Projects for Official Statistics (🔗).
Asia-Pacific Guidelines to Data Integration for Official Statistics (🔗).
ESCAP Working Paper Series: Big Data for SDGs (🔗).
ESCAP Working Paper Series: Big Data for Environment and Agriculture Statistics (🔗).
ESCAP Stats Brief: Big Data for Economic Statistics (🔗).
ESCAP Stats Brief: Big Data for Population and Social Statistics (🔗).
UNSD paper on uses of Big Data for Official Statistics: Privacy, Incentives, Statistical Challenges, and Other Issues (🔗).
European Statistical System Big Data project (🔗).
Paper on “Big Data: What Can Official Statistics Expect?” (🔗)
OECD ‘Smart Data Framework’ (🔗) – 4 steps to create new evidence for policy, source new data, develop a smart data platform, and to cultivate new data ecosystems.
UN Data Revolution Group (🔗).
UNECE classification of Big Data types (🔗).
Example of ONS Big Data project (🔗) - How alternative sources of data and data science methods will affect our processes and outputs.
The HLG-MOS Big Data sandbox project (🔗).
15.2.8 Open data initiatives#
The growth of the open data movement
The first Fundamental Principle of official statistics states that data should “made available on an impartial basis by official statistical agencies….” and recognises the “citizen’s entitlement to public information,” (see Chapter 11.9 — Open data movement). This is a strong statement for an NSO to provide open access to all information produced by the national statistical system.
The term Open Data means that data and content can be freely used, modified, and shared by anyone for any purpose.
However today open access to the data produced by NSOs remains limited. According to the Open Data Barometer that monitors open data initiatives around the world, in 2020, only 11% of dataset entries in the index currently meet the criteria for the data to be considered open.
The criteria for an NSO to make its data open are: that data should be available in a machine-readable format (not PDF files or images); be in non-proprietary formats such as comma-separated values (CSV), text, or Extensible Mark-up Language (XML); provide options for selecting data and for bulk download; and, include any related metadata.
The NSO should make its full range of statistics available via its website, be simple to locate and at the most granular level possible while considering privacy issues. Open data sets should be regularly updated, and an updating schedule published. They should use recognised international standards and definitions for the compilation and documentation of statistics should be used and be fully documented. They should include metadata describing the relevant characteristics (including standards and definitions) of the data, should be readily available with the data and be free of political considerations. The terms under which the data may be used or reused should be non-discriminatory, and the license permit the use and reuse of data without restriction. The data should be interoperable, allowing diverse systems and organizations to work together. In this case, it is the ability to interoperate and intermix different datasets (“Mashups”).
Implications of open data for an NSO IT infrastructure and skill requirements
NSO open data sets should be as accessible as possible, and there should be no barriers such as completing forms or submitting requests or having to use specific browser-oriented technologies (e.g., Flash, JavaScript, cookies or Java applets). An NSO should provide a published Application Programming Interface (API) to facilitate access to data by other systems (also known as Machine-to-Machine access).
Information should be stored in widely-used file formats that easily lend themselves to machine processing and accompanied by documentation related to the format explaining how to use it in relation to the data.
Open Data principles state that data should remain online with appropriate archiving over time and that all data should be available free of charge.
Data Barometer (🔗) / World Wide Web Foundation global measure of how governments are publishing and using open data for accountability, innovation and social impact. The table shows the ranking of countries by the number of open data sets.
The Global Open Data Index (GODI) is the annual global benchmark for publication of open government data, run by the Open Knowledge Network. Our crowdsourced survey measures the openness of government data.
The 5-star deployment scheme for Open Data (🔗) with examples for each step of the star rating and explanations of the associated costs and benefits.
The Open Data Handbook (🔗) which includes guides, case studies and resources for government & civil society, on the “what, why & how” of open data.
The European Data Portal workshop on official statistics as Open Data (🔗).
Open Data Watch (🔗) is an international, non-profit, NGO that monitors open data policies and offers strategic advice and practical assistance to national governments, international organizations, and other NGOs.
15.2.9 Open-source software#
The term Open-source refers to software that has its source code made available by use of a license in which the copyright holder provides the rights to change and distribute the software freely to anyone and for any purpose. Open-source software is frequently developed in a collaborative public manner.
In recent years, the adoption of open-source technologies has increased in NSOs to replace commercial software products. These technologies range from Operating systems (Linux), database management systems (MySQL) and programming languages (PHP, “R”).
Most programming languages in use today have a free software implementation available.
There are two main Open-Source models. The first is known as “Cathedral” where the source code is originally developed by a small group of developers who subsequently distribute each release free of charge – an example is the “R” language. The second is termed the “Bazaar” where source code is developed in public over the internet by a wider group of volunteer developers –examples of this are Linux and Apache. These models benefit from distributed peer review and the transparency of process. Advantages for an NSO include avoiding being locked into using a specific commercial product, flexibility and lower costs.
EU Guidelines on Open-Source Software for Official Statistics (🔗).
UK Government paper “Open-Source Software Options for Government” (🔗).
Canadian Government guidelines on the use of Open Source Software (🔗).
The Open-Source Initiative (OSI) protects and promotes open-source software, development and communities.
Blog guide to Open-Source Software (🔗).
15.2.10 New methods of dissemination, M2M, web services etc.#
New methods of dissemination
Disseminating data is one of the main activities of an NSO, and constant technological advance has to be taken into account. In recent memory, the majority of statistical systems produced paper publications as the main output. This progressed to the production of diskettes and CD-ROMs with the data in simple tables. The growth of the web meant that these files could be made available as downloadable files, and subsequently, data could be accessed interactively via online dissemination systems (see Chapter 11 - Dissemination of Official Statistics).
The current trend is towards machine-to-machine (M2M) access where computer systems access data directly using Application Programming Interfaces (APIs) and web services.
This allows for automated transmission of data between systems in a standard format without human intervention. Using such APIs and standard data formats allows end-users to create new outputs using multiple data sources (known as ‘mashups’). While such mashups have great potential for combining data to find new insights, a concern for an NSO is the lack of control they have over the end uses of their own data in these outputs, and misunderstandings and misinterpretations could arise without clear documentation explaining the data sources and methodologies used in their compilation.
Implications of new dissemination methods for an NSO IT infrastructure and skill requirements
Modern dissemination methods require the appropriate technology infrastructure and skillsets. Staff with the necessary skills to develop the web services and APIs are needed as well as institutional knowledge of the data exchange standards such as SDMX (see Chapter 15.4.5 — Statistical Data and Metadata Exchange (SDMX)). These rapid, automated data dissemination techniques are crucial in the SDG context as they provide the means for countries to deliver high-quality development indicators in a rapid and efficient manner.
The African Information Highway (🔗) is a network of live open data platforms (ODPs) electronically linking all African countries and 16 regional organizations to increase public access to official and other statistics across Africa.
The SIS-CC.Stat is an SDMX (ref para) based modular platform covering the complete end-to-end data lifecycle (GSBPM) from collection through to dissemination.
Australia Bureau of Statistics (ABS) data portal (🔗).
Italian Statistics Office (ISTAT) data portal (🔗).
The ESRI Data Hub for the Sustainable Development Goals (🔗) combines geospatial and statistical information to visualize patterns to monitor, and report their progress on achieving the SDGs within a geographic context.
Ireland’s official boundary data (🔗) as part of a collaborative project between the Central Statistics Office (CSO) and Ordnance Survey Ireland (OSi) to link geography and statistics.
Kenya Open Data (🔗).
15.2.11 Linked data#
The growth of linked data
The term Linked Data refers to the method of publishing structured data so that it can be interlinked through semantic queries, connecting related data that weren’t formerly related. It is defined as “a term used to describe a recommended best practice for exposing, sharing, and connecting pieces of data, information, and knowledge on the Semantic Web”.
In practice, Linked Data builds upon standard Web technologies such as HTTP, the Resource Description Framework (RDF) and Uniform Resource Identifiers (URI), but instead of using them to generate standard web content as pages to be read by users, it extends them to connect information in a way that can be read automatically by computers.
In this way, data is linked to other data, fully exploiting these connections so its value increases exponentially. Thus, data becomes discoverable from other sources and is given a context through links to textual information via glossaries, dictionaries and other vocabularies.
Uses of linked data for an NSO
There are a number of examples of NSOs using Linked data that can be interlinked and become more useful. The process is lengthy and requires significant investment.
LinkedSDGs showcases the usefulness of adopting semantic web technologies and Linked Open Data (LOD) principles for extracting SDG related metadata from documents and establishing the connections among various SDGs (🔗).
SpringerLink Methodological Guidelines for Publishing Government Linked Data (🔗).
The World Wide Web Consortium (W3C) open standards community best practices for publishing statistical Data in Linked Data format (🔗).
UK ONS examples of Linked Data products (🔗).
IStat paper on data innovation in Official Statistics - the leading role of Linked Open Data (🔗).
The Joint Research Centre (JRC) of the European Commission draft guidelines and pilots on Linked Data and Open Data Portals (🔗).
Australian government guidelines for publishing linked datasets (🔗).
15.2.12 Common Statistical Production Architecture (CSPA)#
The growth in use of CSPA by NSOs
The Common Statistical Production Architecture (CSPA) is a framework for developing statistical processing components that are reusable across projects, platforms and organizations - it is often referred to as ‘plug and play’. CSPA has been developed in recent years by the international statistical community under the auspices of the High-Level Group for the Modernisation of Official Statistics (HLG-MOS).
CSPA is an enabler of collaboration and modernisation and has potentially enormous advantages for NSOs of all capacity levels. It aims to align the enterprise architectures of different organizations to create an “industry architecture” for the whole “official statistics industry”.
CSPA provides guidance for building software services that can be shared and reused within and across statistical organizations and enables international collaboration initiatives for the development of common infrastructures and services.
In addition, it encourages alignment with other statistical industry standards such as the Generic Statistical Business Process Model (GSBPM) and the Generic Statistical Information Model (GSIM).
CSPA components focus on statistical production processes as defined by GSBPM and are based on the Service Oriented Architecture (SOA) approach wherein the components (Services) are self-contained and can be reused by a number of business processes either within or across statistical organizations without imposing a technology environment in terms of specific software platforms.
Potential advantages of CSPA for an NSO
There are great potential advantages for an NSO in using CSPA. Its goal is eventually to have components covering all processes and sub-processes covered by GSBPM. This is important for countries of all capacity levels. GSBPM is especially useful for countries of low capacity with weak infrastructure as it can, in theory, allow any country to take advantage of developments by the international statistics community. In this way, an NSO could assemble a complete statistical information system component by component according to their specific needs.
Common Statistical Production Architecture – the Logical Information Model (LIM).
Common Statistical Production Architecture - the Global Artefacts Catalogue (🔗).
Common Statistical Production Architecture – list of CSPA-compliant services developed and under preparation (🔗).
Software available via CSPA inventory (🔗).
15.2.13 Common Statistical Data Architecture#
Data architecture consists of the rules put in place for the collection and storage of data in an organization. The Common Statistical Data Architecture (CSDA) project has been set up to define a reference architecture and guidance for the modernisation of statistical processes and systems.
15.2.14 Data integration / data linkage#
The importance of data integration and data linkage for an NSO
As new data sources are becoming available, an NSOs faces the challenge of finding ways to integrate changeable and often unstructured data with traditional data maintained by the NSO in order to produce new and reliable outputs.
Data integration provides the potential to augment existing datasets with new data sources, and produce timelier, more disaggregated statistics at higher frequencies than traditional approaches alone.
New and emerging technologies are available to support data integration, and an NSO needs to ensure that staff have the necessary new skills, in particular, the need for data scientists - new skills, new methods and new information technology approaches, designing new concepts or aligning existing statistical concepts to the concepts in new data sources.
Examples of data integration and data linkage
There are many possible types of data integration which include using administrative sources with survey and other traditional data; new data sources (such as Big Data) with traditional data sources; geospatial data with statistical information; micro-level data with data at the macro level; and validating data from official sources with data from other sources.
15.2.15 Artificial Intelligence#
Artificial Intelligence (AI) is the development and application of computer systems that can perform tasks normally requiring human intelligence. These tasks include visual perception, speech recognition, decision-making, and translation between languages. The growth in AI has major potential for an NSO.
A main component of AI is Machine Learning which is the way the computer can learn without being explicitly programmed. The goal of machine learning is to build computer systems that can adapt and learn from their experience. It is an application of AI that provides the system with the ability to automatically learn and improve from experience. Machine Learning, at its most basic, is the practice of using algorithms to examine data, learn from it, and then make a judgement or prediction on a particular question. Thus, rather than hand-coding software routines with a specific set of instructions to accomplish a particular task, the machine is “trained” using large amounts of data and algorithms that give it the ability to learn how to perform the task.
An NSO using AI will need to engage staff with a number of new skills, including the various methods of Machine Learning such as Supervised Learning, Unsupervised Learning, Reinforcement Learning and Deep Learning.
There is a strong relationship between AI and Big Data - Machine Learning needs a vast amount of data to learn, whereas Big Data uses AI techniques to extract value from Big Data sets.
AI-based applications can replace or augment certain tasks allowing staff resources to be freed up to do other work, with people having time to focus on creative projects and deal directly with clients and customers. A careful communication strategy will be required for such a game-changing technological transformation.
15.2.16 Data science#
The job title of ‘Data scientist’ has emerged in recent years in parallel with the growth of Big Data. The two fields go hand in hand in the pursuit of extracting knowledge and insights from new data collections in various forms, both huge structured datasets and unstructured alternative data sources.
Data science requires a mix of expertise. Technology skills are required to manipulate Big Data using techniques such as massive parallel processing to analyse volatile unstructured data, perform data cleansing and then distilling it into a format suitable for analysis. Mathematical skills are needed to write the complex algorithms used in analysing these data. Statistical skills are needed to investigate the data and to respond to questions and derive insights from them. Other skills, like Machine Learning (🔗) and Deep Learning (🔗), may also be required.
Data Scientist candidates are consequently a highly sought-after species, and many universities now offer data science courses.
Given the range of skills involved in data science, the reality is that such tasks are carried out by a team rather than a single individual.
Such teams consist of a data engineer who would access the primary data source and render it into a structured format, a software developer to write the routines to clean and aggregate the data and the data scientist who would create algorithms and use statistical techniques to gain insights from the data.
A typical list of the required competences for a Data Science position would include:
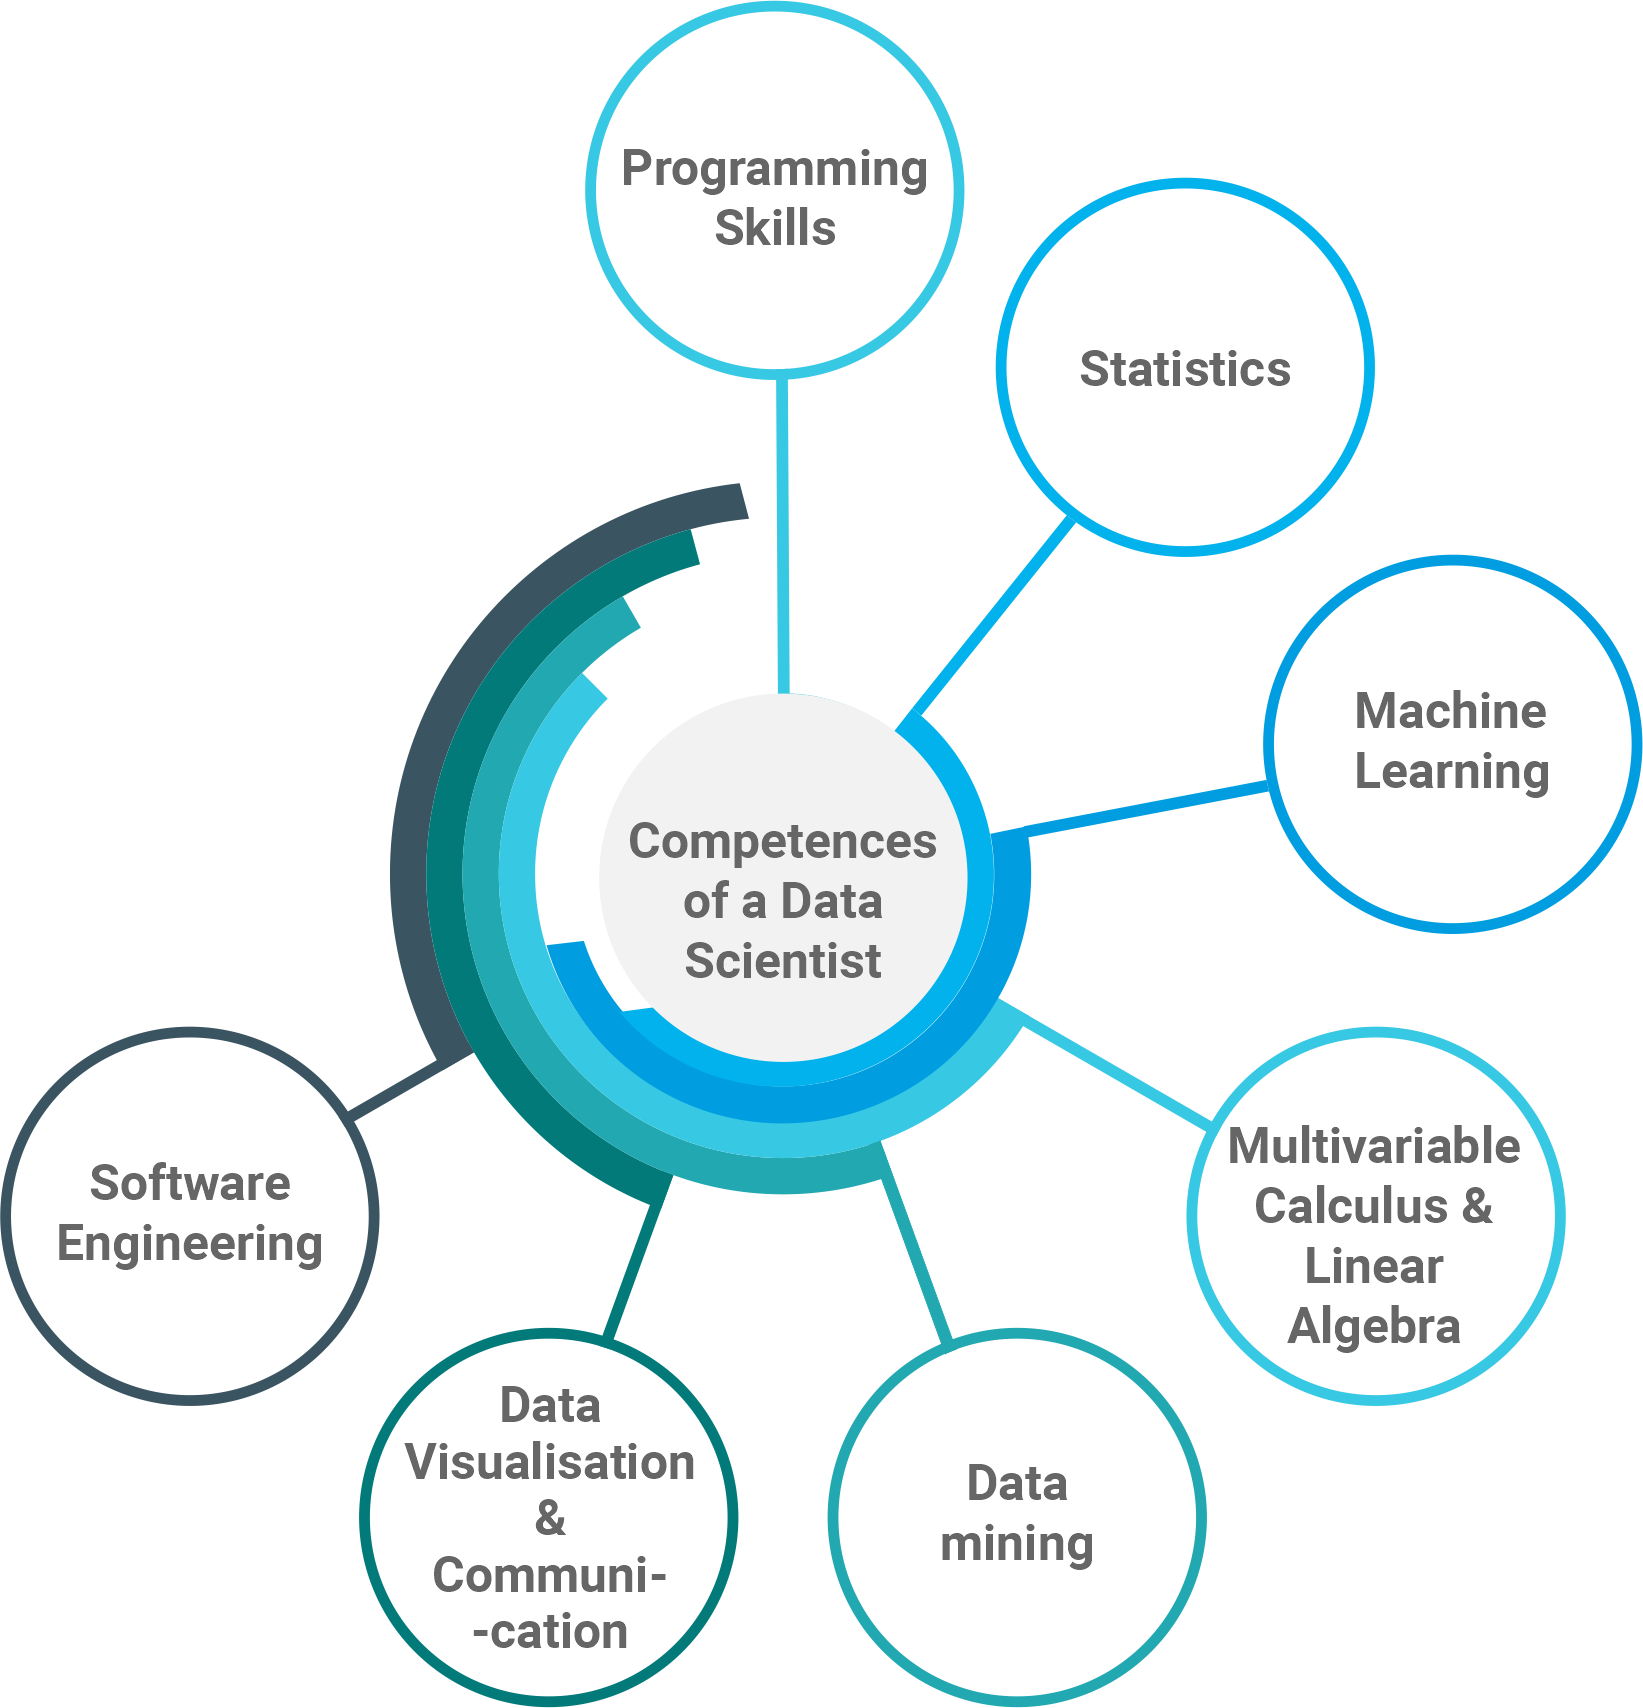
Programming Skills;
Statistics;
Machine Learning;
Multivariable Calculus & Linear Algebra;
Data mining;
Data Visualisation & Communication;
Software Engineering.
UK Government Data Science Ethical Framework (🔗).
15.2.17 Data security#
Data security is of paramount importance for an NSO. Confidentiality and privacy are, therefore, one of the most important of the Fundamental principles (Chapter 3.2.6 — Principle 6 - Confidentiality) and a major concern for citizens. Maintaining data security is vital for the good reputation of an NSO.
National statistics are aggregated from individual records and often contain personal or commercial information - thus security measures must be designed to preserve data confidentiality and ensure data is accessible only by authorised people and only on as-needed basis.
Alongside public concerns with data confidentiality and privacy, there is a growing demand for researchers to access microdata – and this access is often limited by the fear that confidentiality protection cannot be guaranteed.
There are a number of ways an NSO can address data security. Security measures can be implemented at the level of the data by using anonymisation techniques so that individual records in a microdata set have personal details removed so that identification of individuals is highly unlikely.
Security measures can be put in place at the physical level by restricting access to where the data is stored and implementing strict data controls. Many NSOs have set up Data Laboratories where on-site access to microdata is under NSO supervision with strict audit trails and supervision to ensure no confidential data leaves the premises.
An alternative to Data Laboratories is Remote Access Facilities (RAFs). RAFs are becoming increasingly important as a way of facilitating secure access to microdata in order that researchers do not have to suffer the inconvenience of having to go to the NSO premises but can rather launch algorithms for microdata remotely via the internet. The job is then run by the NSO and results returned to the researcher while the microdata does not actually leave the NSO.
Procedural measures include vetting processes to approve requests for an individual researcher to access microdata and the signing of contractual agreements with these researchers that include penalties if security rules are breached.
UNSC Principles and Guidelines for Managing Statistical Confidentiality and Microdata Access (🔗).
European Statistical System Handbook on Statistical Disclosure Control (🔗).
International Household Survey Network – guidelines on Microdata anonymisation (🔗).