6.3 National statistical office as an organization#
6.3.1 Administrative structure and finance of the national statistical office#
Administrative structure of the NSO
NSOs are organized in different ways, and their administrative solutions depend not only on the history, political and legal environment but also on specific national circumstances of each country. The Guidance on modernising statistical legislation (UNECE 2018) (🔗) states that producers of official statistics should in principle, be distinct from the government and be organized as separate entities from other government departments. The Guidance describes three types of basic distinctions that differentiate statistical systems and in turn, influence the way an NSO is organized.

It distinguishes between centralised systems (such as in Australia, Canada, or Mexico), partially decentralized (such as in the US and UK) as well as regionally decentralised statistical systems.
The UNECE Guidance differentiates statistical systems in relation to reporting lines to the government. Although an NSO can be referred to as ‘office’, ‘bureau’, ‘agency’, ‘institute’, ‘body’ or ‘authority’, the administrative status varies from country to country, and the name is not helpful in determining the administrative status of the authority. In any event, an NSO should be a state body, and for issues that are not covered by professional independence, it may report either to the Government (directly to the Prime Minister or indirectly through a responsible Minister), to the Parliament (directly or through an appointed managerial body) or to the President of the country. Alternatively, it can report to a body (management board) appointed by the Government, Parliament, or the President – in which case it can be considered an autonomous (or semi-autonomous) agency.
The various administrative solutions have their respective advantages and disadvantages, and these can be related directly or indirectly to the following factors:
the legislative authority of the office: level of autonomy in drafting and proposing statistical laws and bylaws that regulate the whole statistical system;
budgetary autonomy: ability to reallocate the assigned funds within a budgetary year without external interference;
staffing: the ability to hire the required staff without external administrative barriers, non-related to budgetary issues;
wages: the ability to pay competitive salaries to staff, i.e. IT or statistical experts; and
organization: ability to implement internal organization structure without external barriers.
Any changes to the administrative status, particularly those enacted through the national statistical law, should be handled with care. The process of creating or amending the law can take considerable time and creates an opportunity for other actors to influence statistical legislation.
Amendments in the scope and range of activities within the NSS require a specific high-level policy decision by the central government and may even involve special legislation. Such a decision is not likely to be influenced entirely by the results of an objective analysis of the alternatives. Inevitably, past practices, interdepartmental rivalries, the structure and size of government, the impact of tradition and personalities, and so on come into play. Moreover, when possible changes in the organization of the NSS or the NSO are considered, short-run disruptions in service caused by the change must be weighed against the long-run gains.
Organizing the NSO
NSOs have generally been organized either according to subject matter or function, but most commonly by combining the two approaches.
A review undertaken by the Turkish Statistical Institute under the auspices of the Conference of European Statisticians 2014/2015 classifies NSOs organizational structures into three most common basic types of organization (In-depth review of process-oriented approach to statistical production) (🔗):
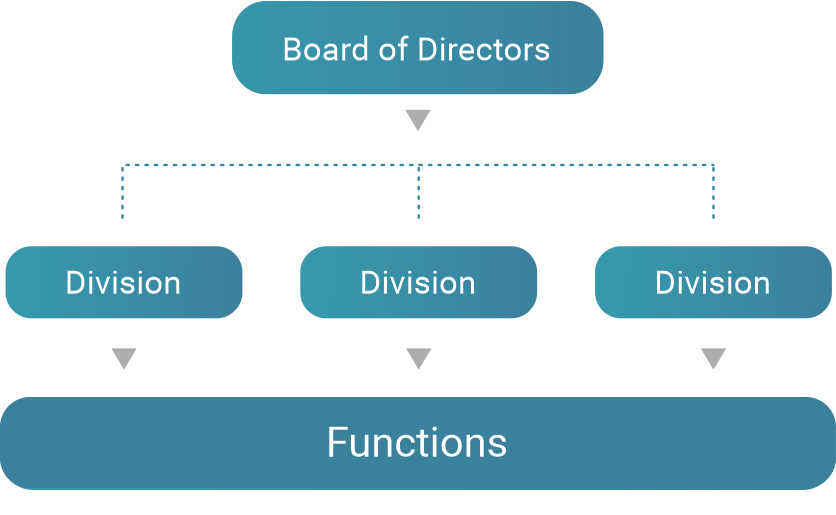
Divisional structure: a division is a collection of functions which produce a specific product. The divisional structure or product structure consists of self-contained divisions. This type of structure is close to stovepipe structuring, where units are based on statistical domains, responsible for the production of a certain product.
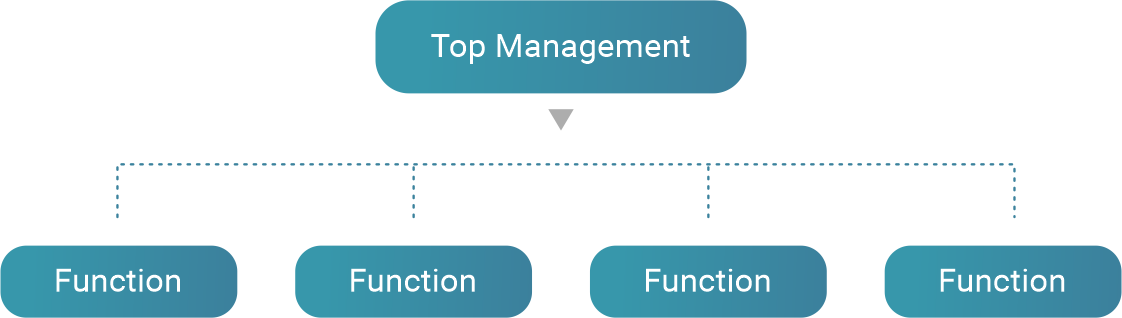
Functional structure: in functional organizations, units are based on functions. In the case of NSOs, these functions could be specified as data collection, processing, dissemination, etc.
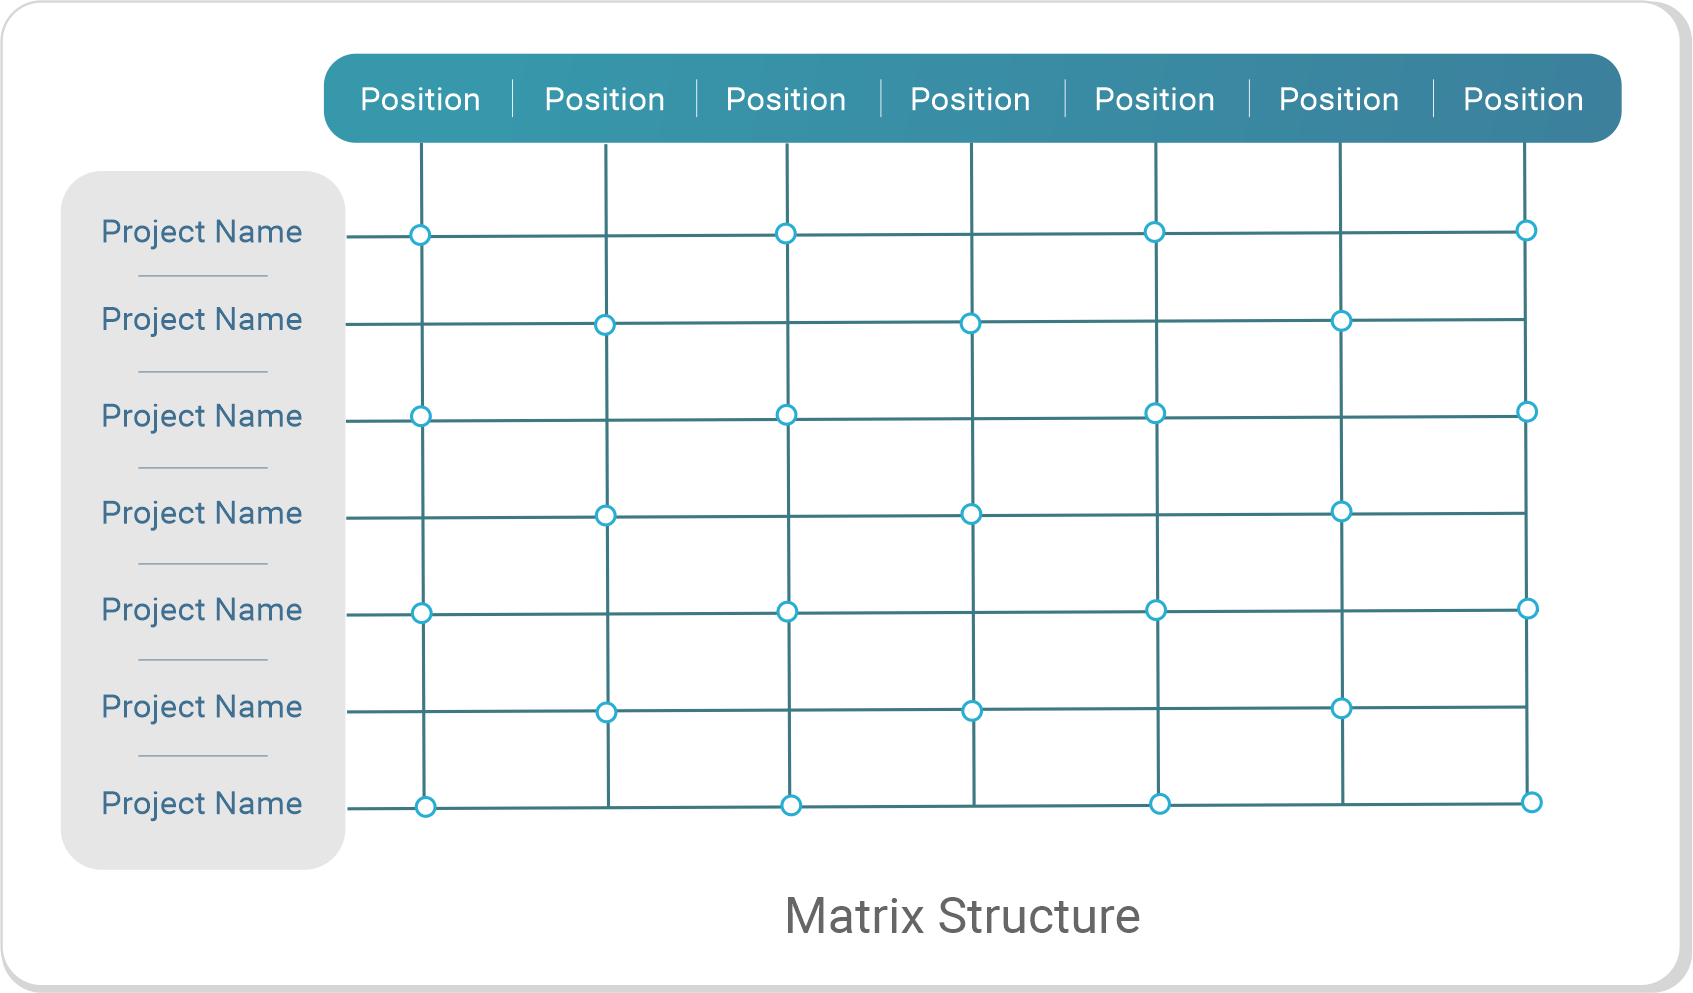
Matrix structure: this type of structure is a mix of functional and divisional organizational structure, with dual reporting lines.
The divisional structure - commonly referred to as stovepipes - commonly used in various parts of government administration may lead to inefficiencies. It should be noted, however, that this approach has significant benefits. Communication from the Commission to the European Parliament and the Council on the production method of EU statistics (COM (2009) 404 final) (🔗):
The stovepipe model is the outcome of a long historical process in which statistics in individual domains have developed independently. It has several advantages: the production processes are best adapted to the corresponding products; it is flexible in that it can adapt quickly to relatively minor changes in the underlying phenomena that the data describe; it is under the control of the domain manager, and it results in low-risk business architecture, as a problem in one of the production processes should normally not affect the rest of the production.
The advantage of the stovepipe model is that it can create specialized substance knowledge developed and maintained in the team, thus leading to improved quality of statistics. On the other hand, a stovepipe model would inevitably lead to differences in quality, response burden and costs between statistical domains. The Commission communication also states:
However, the stovepipe model also has several disadvantages. First, it imposes an unnecessarily heavy burden on respondents. Given that data collection in different domains is done in an independent and uncoordinated manner, respondents are regularly asked for the same information more than once. Second, the stovepipe model is not well adapted to collect data on phenomena that cover multiple dimensions, such as globalisation or climate change. Finally, this way of production is highly inefficient and costly, as it does not make use of standardisation between areas and collaboration between Member States. Redundancies and duplication of work, be it in development, in production or in dissemination processes are unavoidable.
The most common interpretation of subject matter versus function leads on the one hand to the creation of divisions such as trade, industry, health and education, and on the other hand to functions such as sample survey design, data entry and data editing, field operations, quality, analysis and dissemination. From a production perspective, some functions can be grouped into agency-wide functional units, such as sample design and fieldwork. Other functions that generally require the direct involvement of a subject-matter specialist would be better placed with subject-matter units.
It should be well noted that data collection should be organized as efficiently as possible in order to minimise the burden, both, for the respondents and the collecting agency. Statistical dissemination should be user-focused rather than based on statistical sources and processes.
The in-depth review of the process-oriented approach to statistical production mentioned above also stipulates that “Stovepipes and silos may exist no matter how the organization is structured. Therefore, looking for a structural solution for silos may not always be the right approach.
Creating bridges across silos, improving communication between departments and ensuring that they are working efficiently toward the same goals could be are more important than the structure of the organization.
If there is organization-wide encouragement to work well across divisions, then silos could disappear. In addition, process improvement and re-engineering also bring widespread change in the organization, and organizations move toward a matrix or process-based functioning.”
Examples of simple re-engineering and taking steps towards a process-oriented organization can be found in many NSOs. It was noticed that due to seasonality in data collection, savings could be achieved by grouping data collection, editing and processing into dedicated units. Leaving them in the subject area organizational units can be inefficient and lead to excessive capacity during certain periods. For example, data collection in a certain monthly survey finishes around the 15th of each month, and data editing must be finished within the next 10 days. If data editing and processing are performed exclusively by the subject matter unit, this leads to the need for additional human resources, that are fully utilised only during the data processing phase. If the tasks within the data processing phase are performed in the data editing and/or processing unit, the workflow between various data collection processes can be distributed, and significant savings can be achieved. The most common argument against this is that processing outside of the subject unit would reduce quality. This could be remedied by the introduction of quality checks or by combining only similar types of processing.
Analytical frameworks such as national accounts and environmental accounts have been the driving force for introducing horizontal approach into NSOs.
National accounts produce a wide array of interlinked products, with varying deadlines. Therefore, organizing their production into a one-dimensional structure is often inefficient and may lead to inconsistencies and interpersonal conflicts. A common way around this issue is to establish cross-domain committees, that can bridge and interconnect to mitigate the stovepipe impediments. National accounts departments organized according to the divisional approach may lead to stovepipes and suboptimal prioritisation. The focus of the work would naturally be on the improvement of individual products, rather than on an integrated approach that can lead to overall improvements in consistency and quality. By introducing a matrix organization, or by mimicking it with the introduction of product-related committees, production can be optimised for each domain while simultaneously enhancing coordination and increasing consistency (see Chapter 10 - Analysis and Analytical Frameworks).
Reorganizing the production process – the GSBPM
In view of the deficiencies of the stovepipe organization and production system, efforts have been made in the last few years to create a more functional system for the statistical production processes. A major milestone in these efforts was the development of the Generic Statistical Business Process Model (GSBPM). This model has been developed under the coordination of the Statistical Division of the UNECE in Geneva, based on innovative practices in a few leading NSOs. The GSBPM seeks to describe and guide the overall process of the statistical production as well as the individual production processes. The idea behind the GSBPM is that statistical production is better organised around functions than subject matters and that the same procedures can be utilised for the generation of several subject matter statistics. Thus, as an example, the same procedures for collecting data apply to several subject matter areas. Also, instead of designing and building specific methods and IT tools for each subject matter area, the idea is to build methods and tools for the different functions that can be utilised in many subject matter areas.

Fig. 7 GSBPM#
The GSBPM provides a systematic overview of tasks and activities that need to be undertaken when converting input data into statistical information. Initial versions of the GSBPM were oriented mainly around survey collection, while the most recent revision (v.5.1) also reflects the business processes for administrative data, commercial Big Data, geospatial data and other data sources, as well as statistical products using mixed data sources such as national accounts. The creators of the GSBPM note that it should be applied and interpreted flexibly. It is not a rigid framework in which all steps must be followed in a strict order. Instead, it identifies the possible steps in the statistical business process and the inter-dependencies between them.
GSBPM standardises process terminology. This allows an NSO to compare and benchmark processes within and between organizations. It can help identify synergies between processes in order to make informed decisions on systems architectures and organization of resources.
GSBPM is not a linear model – instead, it should be seen as a matrix through which there are many possible paths, including iterative loops within and between processes and sub-processes.
GSBPM contributes to a common vocabulary used within an NSO and between statistical organizations - having a standard terminology makes it much easier to communicate on collaboration projects. It can be used as a reference in planning, mapping, documentation and self-assessment of capacity needs.
The GSBPM identifies and describes eight phases of the overall statistical production process (specify needs, design, build, collect, process, analyse, disseminate, and evaluate) each of which is divided into sub-processes, sub-processes in all.
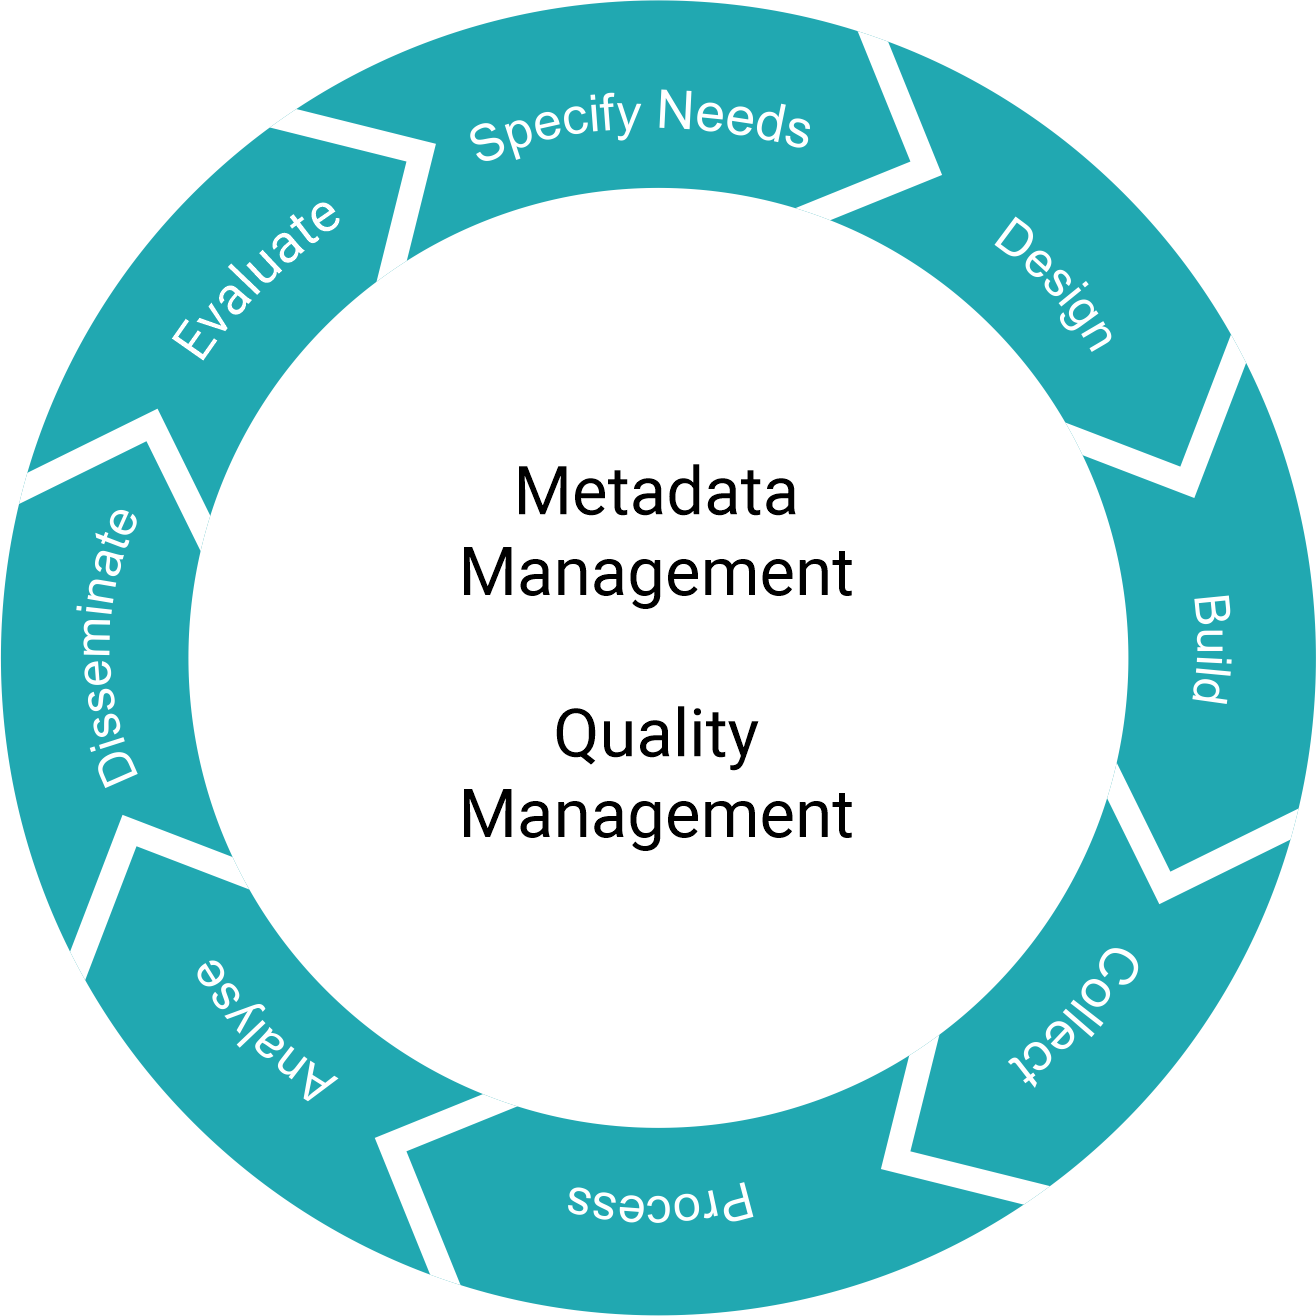
Specify Needs phase: The ‘Specify Needs’ phase is probably the most important phase of any statistical activity, as it is used to define the scope of data collection activities and often transpose, vague demands into concrete plans. This is the phase of planning, identification of user needs, establishing research objectives, specifying information needs and consultation with the users. Investigation of concepts, data availability (such as administrative records) and practices in other countries are particularly important as they might prevent placing an unnecessary burden on respondents. This phase often requires direct involvement of the chief statistician, particularly during user consultations when it might be important to reduce the pressure of the users for collecting too many variables – which can reduce the quality of the results. It also includes the planning of survey stages and determining the role of administrative data. It ends with the approval or disapproval of the business case, usually done through appropriate sponsors and governance committees (see Chapter 6.4.2 — Internal advisory and decision-making bodies).
Design phase: The ‘Design’ phase describes the development and design activities, and any associated practical research work needed to define the statistical outputs, concepts, methodologies, collection instruments and operational processes. It determines the most appropriate collection method and generally includes all the design elements needed to define or refine the statistical products or services identified in the business case (IT, sampling, collection, dissemination…). This phase specifies all relevant metadata (including extractions from statistical, administrative, geospatial and other non-statistical registers and databases), ready for use later in the business process, as well as quality assurance procedures. Design activities make substantial use of international and national standards in order to reduce the length and cost of the design process and enhance the comparability and usability of outputs. Reuse and adaptation of design elements from existing processes are also encouraged. The ‘Design’ phase is a time of intensive inter-departmental cooperation - ideas must be turned into concrete plans and specialists for various processes have to be included.
Build phase: The ‘Build’ phase builds and tests the production solution to the point where it is completely ready for use. The outputs of the previous phase are assembled and configured to create a complete operational environment to run the process. Workflows are configured, routines and procedures are tested and documented. Pilot data collection is typically performed in this phase, and the training of users is performed. For statistical outputs produced regularly, this phase usually occurs for the first iteration, following a review or a change in methodology or technology, rather than for every iteration.
Collect phase: The ‘Collect’ phase contains the collection of all necessary information, but also covers the preparatory processes that are intended to ensure that people, processes and technology are ready to collect the required data and metadata. It includes the creation of the frame and selection of sample, training of collection staff, ensuring the availability of collection instruments, providing information to respondents, minimizing non-response and loading the collected information into an environment suitable for processing. Depending on the geographical frame and the technology used, geo-coding may need to be done simultaneously with the collection of the data by using inputs from GPS systems, putting a mark on a map, etc.
Process Phase: The ‘Process’ phase describes the processing of input data and their preparation for analysis. It is made up of sub-processes that integrate, classify, check, clean, and transform input data to be analysed and disseminated as statistical outputs. For statistical outputs produced regularly, this phase occurs in each iteration. The sub-processes in this phase can apply to data from both statistical and non-statistical sources (apart from sub-process 5.6 (Calculate weights), usually specific to survey data). The ‘Process’ and ‘Analyse’ phases can be iterative and parallel. Analysis can reveal a broader understanding of the data, making it apparent that additional processing is needed.
Analyse Phase: In the ‘Analyse’ phase, statistical outputs are produced and examined in detail. It includes preparing statistical content (including commentary, technical notes, etc.), and ensuring outputs are ‘fit for purpose’ prior to dissemination to users. The preparation of maps, GIS outputs and geo-statistical services can be included to maximise the value and capacity to analyse the statistical information. This phase also includes the sub-processes and activities that enable statistical analysts to understand the data and the statistics produced. The outputs of this phase could also be used as an input to other sub-processes (e.g., analysis of new sources as input to the ‘Design’ phase). For statistical outputs produced regularly, this phase occurs in every iteration. The ‘Analyse’ phase and sub-processes are generic for all statistical outputs, regardless of how the data were sourced.
Disseminate Phase: The ‘Disseminate’ phase manages the release of the statistical products to users. It includes all activities associated with assembling and releasing statistical products via different channels, such as formatting and loading information into output systems, preparing the product components (explanatory texts, tables, charts, maps, quality statements etc.), promotion and managing user support. These activities support users to access and use the products released by the statistical organization. For more information see Chapter 11 - Dissemination of Official Statistics.
Evaluate Phase: The ‘Evaluate’ phase manages the evaluation of a specific instance in a statistical business process. It can take place at the end of the instance of the process but can also be done on an ongoing basis during the statistical production process. It relies on inputs gathered throughout the different phases. It includes evaluating the success of a specific instance of the statistical business process, drawing on a range of quantitative and qualitative inputs, and identifying and prioritising potential improvements.
See also Chapter 15.4 — Use of standards and generic models in an NSO.
6.3.2 Central office and regional network#
Statistical systems vary from country to country. Some countries, particularly small ones, have an NSO, normally located in the capital city, operating on a country-wide basis. Many countries have the NSO headquarters located in the capital (in some countries the NSO head office is located in another city) and a network of regional offices controlled by the central office. In this form, the role of the regional offices is usually mainly to undertake and oversee data collection as prescribed by the central office. Coordination in such systems should proceed smoothly provided the central office has sufficient resources for training regional staff. (For an overview of Federal systems see Chapter 4 - The National Statistical System). There are examples of countries with a number of sub-ordinate offices, located in different regions of the country, that are specialized in particular statistics or subject matters. Thus, one such sub-ordinate or regional office may be responsible for the entire production process in a given subject or domain, such as labour market statistics (including conducting labour force surveys), environment statistics or health statistics.
Statistical systems vary considerably regarding the extent to which the official statistics are collected, processed and disseminated by the NSO or other producers of statistics.
This is referred to as having different degrees of functionally centralized or decentralized statistical systems (see further discussion in Chapter 4 - The National Statistical System).
Although many statistical processes have been redesigned as a result of the introduction of modern technology, some official statistics require or benefit from direct contact with respondents. Due to historical reasons, administrative arrangements and territorial divisions often make regional presence mandatory or unavoidable. In the past, when data collection was done mainly via paper format, the regional presence was more or less unavoidable or at least preferable. The work process was commonly carried out in both the head office and the regional offices. Thus, the regional offices would be responsible for data collection, data entry, basic checks and data editing while the head office undertook the processing and analysis. With the introduction of online, electronic forms and automated transfer of data (machine to machine), the data entry phase was transferred to the respondent. Many quality checks and corrections are now performed by automated logical controls embedded into data collection systems, while the use of databases encourages central processing and preparation of data. This has led to the strengthening of the central office’s role and responsibilities while reducing the importance and scope of work in the regional offices. The increasing use of administrative data for statistical purposes, replacing or augmenting survey data, has had a similar effect on reducing the need for regional offices. The use of computer-assisted telephone inquiries also reduces the need for regional presence.
Regional presence remains important in large countries and in large-scale data collection activities such as censuses and price collections for the compilation of the Consumer Price Index (CPI). Therefore, many NSOs have tried to find a way to redistribute tasks locally or to find new activities for staff employed in the regional offices. The most common example of new activities is the introduction of additional controls and quality checks of register information, such as validation of local unit information in the business register and for follow-up activities of business surveys, even those carried out through portals. For tasks such as telephone data collection, regional offices can perform additional checks or telephone reminders. In addition, some NSOs have transferred entire functions to be undertaken at the regional level, for example, Canada and France, where regional offices play a key role as dissemination centres. In Australia, the regional offices act as national centres for certain areas of statistics, for example, the office in Victoria (Melbourne) is responsible for the compilation and dissemination of statistics on the services sector for the entire country. The same system is applied in Poland. Regional offices often compile or disseminate regional statistics and thus have an important role in customer service.
The relationship of an NSO with regional bodies remains an important issue. Depending on the country’s administrative arrangements, data collection or supplying of statistical information at the regional level might play an important role. This is discussed further in Chapter 4 - The National Statistical System concerning the division of responsibilities in federal states.
6.3.3 Finance of the NSO#
Adequate funding of statistics is a key issue in sustained statistical capacity-building around the globe.
Even though it could appear that financing for official statistics is stable as regards the regular statistical programme of work, IT and other statistical infrastructures generally require significant investments in order to keep pace with modern technology and growing users’ requirements.
Unfortunately, this is not always achievable through regular financing, and NSOs are encouraged to use large activities (such as population censuses) or external (project) financing (e.g. from international donors) to finance the system-wide infrastructure upgrades.
Internationally comparable official statistics are a public good that provides relevant information necessary for the functioning of a democratic society. Therefore, official statistics must be (directly or indirectly) funded from the government budget. The process of securing sufficient budgetary funding is country-specific, but there are many similarities. Although financing official statistics is often not a government priority, statistical offices have an advantage over other administrative bodies in that their programs are clear, transparent, systematic and are based on international cooperation, manuals and recommendations. This makes lobbying for funding easier, as the chief statistician and management of the office can provide persuasive arguments when requesting additional funding. Ideally, a statistical office should know exactly how much each statistical product costs (which can be achieved through cost-accounting) or at least provide a reasonable estimate. This approach also helps fight budget reductions, as an argument can be made that statistical activities need to be cut if a significant reduction of budgetary allocation is demanded. In addition, the process also generally involves ensuring political support for planned activities, which can be achieved through engagement with the user community, statistical council or personal engagement of the chief statistician.
The status of the NSO can have a significant impact on its position within the government budget. Some NSOs have a dedicated budget line, while for others the budget of the NSO is included in the budget of another government entity (ministry, parliament, the office of prime minister or general administration). The regular budgetary procedure is usually based on what was allocated in the previous year +/- a certain percentage, and therefore having a dedicated line may lead to more stable financing, while having a joint line may lead to more frequent decreases and increases. In any event, the best way to secure additional funding is by introducing new specific activities.
Box 3: Statistics Australia successful bid for additional funding
In 2014, the Australian Bureau of Statistics presented a detailed plan for modernizing the Australian statistical system (🔗), arguing that the data landscape had changed and that it could not continue to produce high quality official statistics with decreasing budgets and outdated IT infrastructure. The Bureau outlined a detailed plan and managed to persuade the government to secure a significant increase in funding over the next 5 year-financial cycle (in total 257 million AUD – which is about 12% of ABS 5-year budget, excluding census). The plan included a procurement of new IT systems with significantly improved security features, improvements in administrative data acquisition and integration, web page redesign, improvement to metadata management, training of staff and new services.
Some NSOs are able to secure additional funding by selling more statistical products and services on the market, while in some countries this revenue goes to the national treasury and statistical offices cannot use it as part of their budget. Even though additional sources of funding can be used to finance various activities, public service organizations should not compete on the market and production of public goods should be publicly funded. However, NSOs are in possession of datasets not held by others. These datasets may be underused as NSOs do not have the resources to make all combinations and aggregations of data readily available. Many user needs are also so specific that it would not be acceptable to use public funds to compile statistics to serve a narrow user need. As NSOs are public organizations, chargeable services cannot produce profit. They can only cover the costs of the additional work and the required infrastructure, such as IT and staff training. Use of those resources should be transparent (see Chapter 11.8 — Recovering dissemination costs).
The NSO may provide statistical services to other government bodies, international organizations and the private sector. Such statistical services may include sample selection from a public register, data collection, weighting of survey results, aggregation and compilation, composite indicator creation, seasonal adjustment, drafting of metadata, advisory services, anonymisation of data, disclosure control, data linking, preparation of tables, analysis and others. However, some NSOs may not be motivated to perform these kinds of activities as their administrative systems do not allow retention of recovered costs.
Additional income can in some countries be secured through selling statistical “goods “defined as “self-contained arrays of quantitative information, with or without interpretation, which can be stored for future retrieval. The medium in which these arrays are recorded is immaterial.” Such goods might include a yearbook of national accounts; a removable media with the standard industrial classification; and tables on exports and imports by commodity groupings, downloadable from a web site. Additionally, statistical goods might include applications that can be used by the government or the public or pre-prepared microdata for scientific purposes, accessible via encrypted and coded media, remote access or safe room access. Microdata access for scientific purposes might also, in some cases, include statistical services – such as data linking. (See Chapter 11.5.3 — Microdata. Pricing of statistical goods and services should be dealt with particular care as the main motive for putting a price on them should be recovering the costs for additional service and not on earning additional income.