7.2 Measuring and analysing user satisfaction and needs#
Users can be classified into different groups.
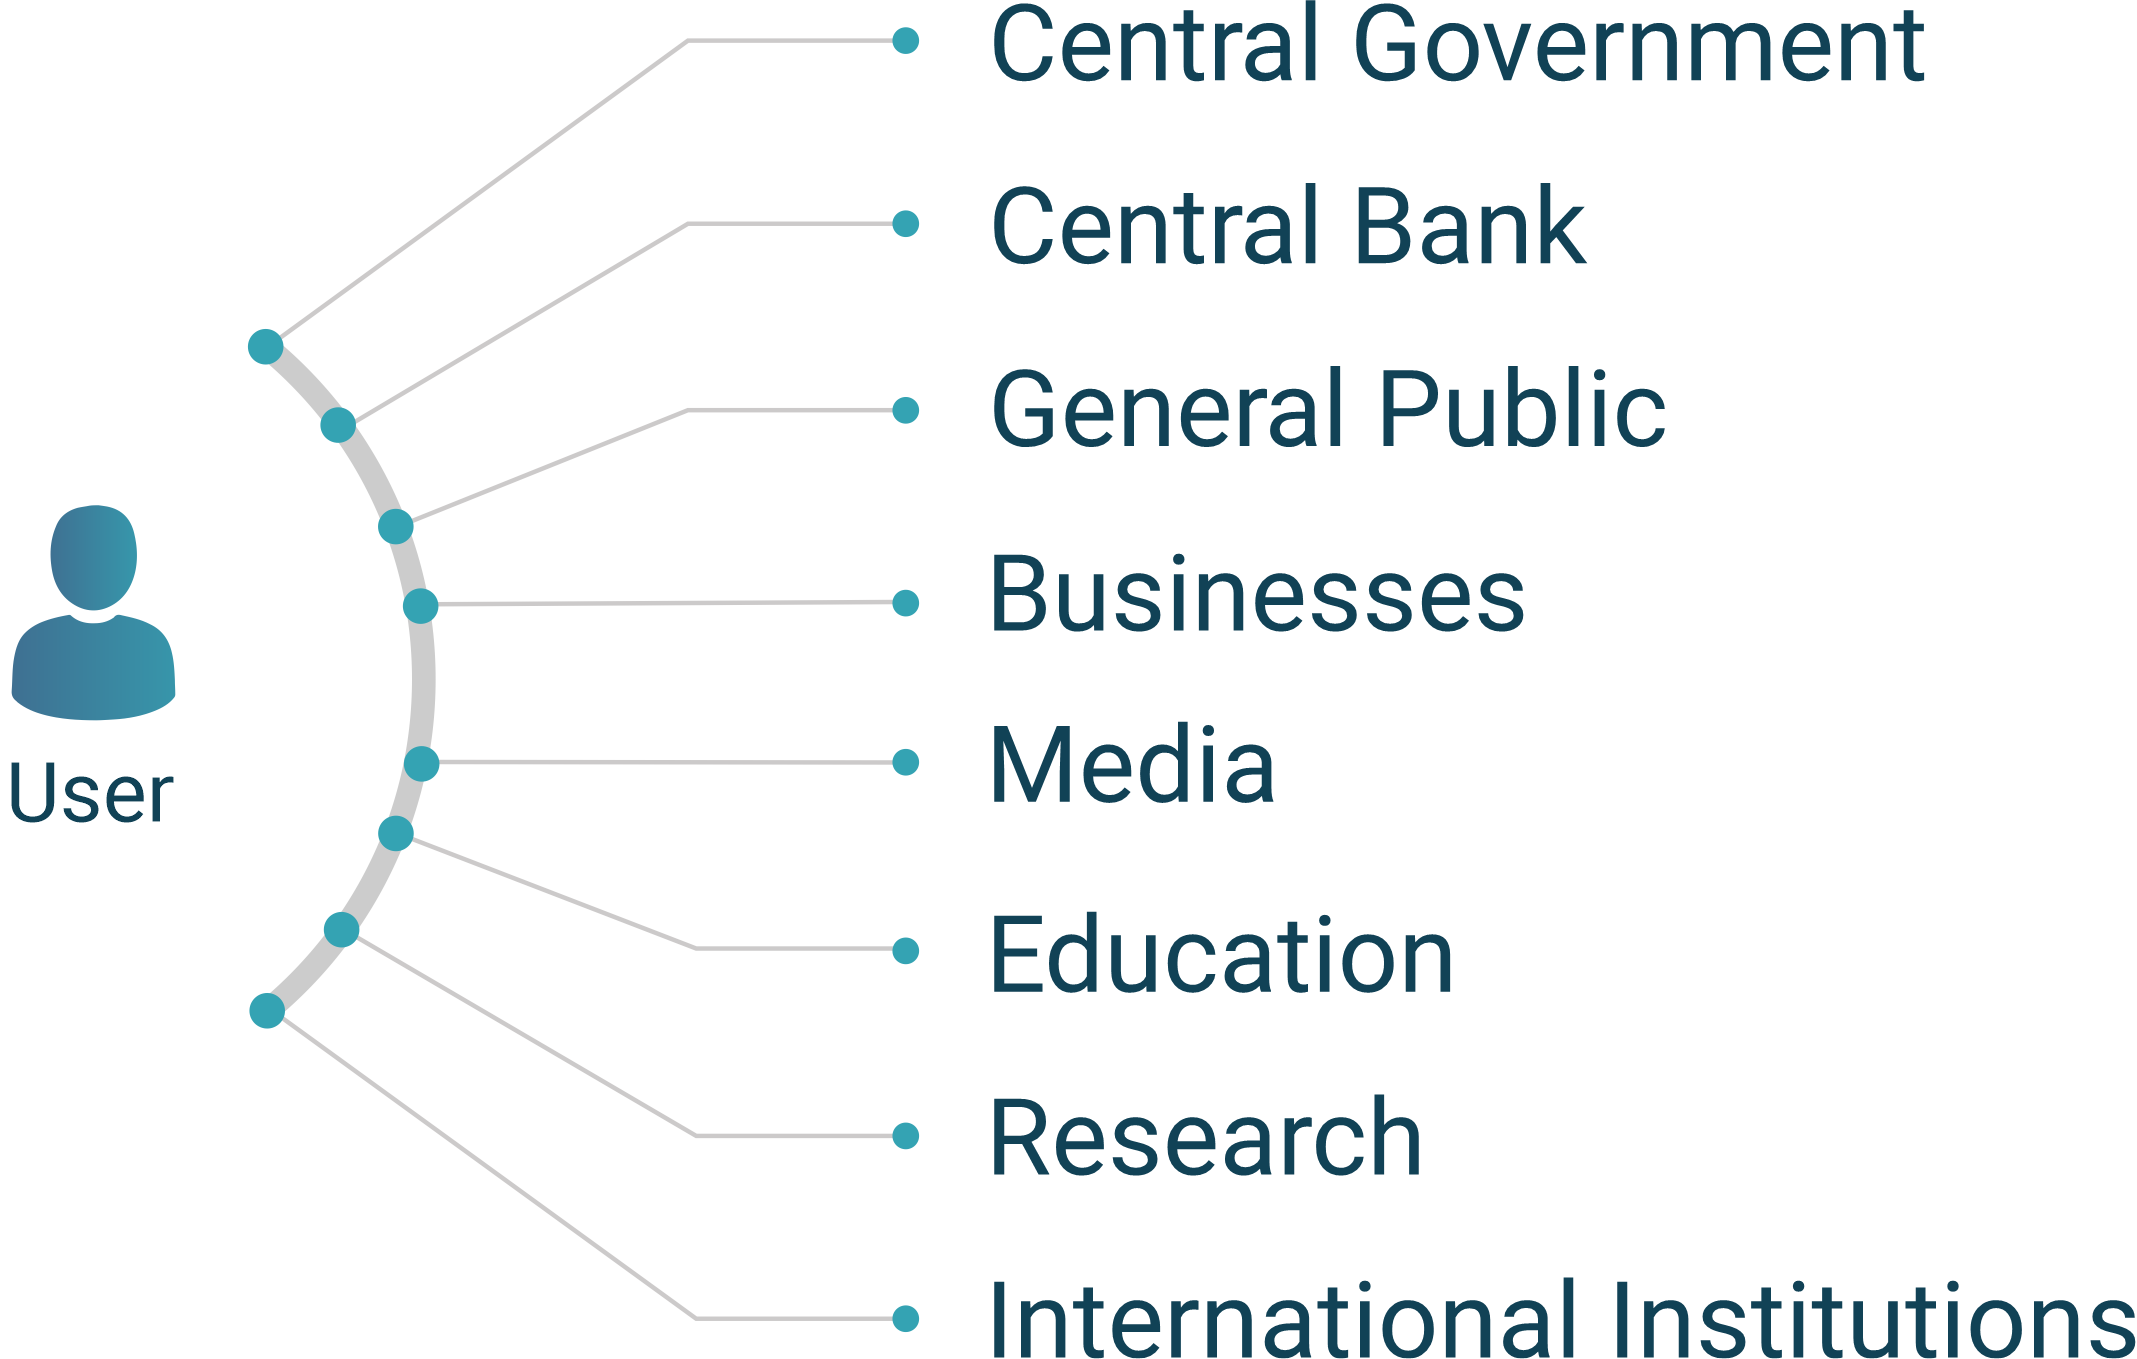
This chapter describes users as belonging to the categories of central government, including the central bank, the general public, businesses, the media, and education, research and international institutions.
There are other ways to categorise users - the European Statistical Advisory Committee (ESAC) has noted in its paper on the role of communication in statistical science and the strategies of communication for statistics users (🔗) the importance of identifying different types of users of statistics, understanding their needs and creating a strong communication strategy.
An NSO needs to constantly measure and analyse their response to user needs, monitor how statistics are used and by whom, and gather user feedback and commentary from among the various user groups of statistical data. This is not only to know the users better; it is also to know better how an NSO is performing in the eyes of its users. An NSO also needs to assess how it is reaching potential new users.
User surveys are an important tool to assess user confidence and trust in official statistics, the usefulness of available statistics and accessibility of official statistics and related services. Surveys can be web-based and should phrase questions using language that respondents can be expected to understand. Survey questions should cover the usability, functionality, and availability of any online statistics dissemination platforms. It should seek to get user feedback on the quality of the statistics, based on the quality dimensions of relevance, accuracy, coherence, credibility, timeliness, accessibility, and interpretability.
The following areas could be measured by user surveys:

Satisfaction with products and services: This analysis could be further deepened by an analysis of the characteristics of official statistics (e.g., timeliness, accuracy, trustworthiness, (inter)national comparability, etc.). Questions on preferences for the type of access (online, phone, in-person), device type(s) used and preferred media further inform the picture of our customers.

User support quality: Could be measured by asking about the user’s perception of user services provided, what works and what should be improved.

Design, communication and metadata: Here, questions could be raised on the design of the official statistics website in general, and the statistical warehouse in particular: how easy/difficult it is to navigate and find the relevant information, how satisfied the user is about the visualizations offered (videos, infographics, maps, graphs, indicator sets), etc.

Relevance, responsiveness and innovation: How effectively does the statistical office inform the public debate on current issues, are they innovative (e.g., using new technologies, methods and data sources), how important are official statistics in helping to understand societal developments.

Awareness of brand and message: Could include analysis of the trust in official statistics, the perceived lack of political interference, and the overall satisfaction with the statistical office and the understanding of its remit.

Specific products and services: This could be measured after a user has received a tailored statistical service, or by asking if the user has heard of a particular statistical product (e.g., provide a list) and then ask how satisfied the user was with the quality of the product or service.
A number of indicators can also be compiled using data that accumulate online. Tools such as Google Analytics and media monitoring can help to measure the use and reach of official statistics. User profiling techniques can be employed to identify the data about different user domains.
It may be useful to collect user feedback and compile indicators to assess adherence to the Fundamental Principles of Official Statistics. These are listed in the annex 3 of the UNECE Recommendations for promoting, measuring and communicating the value of official statistics:
Use of statistics with indicators such as the number of visits to the website and data downloads, by topic. On a sample basis, these data could be complemented by information on the type of users, and whether or not the users could (easily) retrieve the statistics, and whether or not they are satisfied with the service.
Relevance of statistics such as the number of citations in the main newspapers/news-websites, radio and television channels to assess the impact of statistical “news”, their relevance for public debate, the branding of and the trust in official statistics. The number of citations in research and policy would provide a different viewpoint. An analysis of the alternative data sources used may provide additional information on why users did not use official statistics.
Transparency of statistical production measured by the publication of an advance release calendar and the adherence to this calendar. In addition, one could collect information on the availability of metadata and other materials and resources about statistics.
Quality of statistics indicators could be multiple, for instance, one could look at the magnitude and direction of regular revisions, e.g., in economic statistics or a continually updated list of international best practices implemented by the statistical office.
The following activities could form part of the user engagement strategy to measure and analyse user satisfaction and needs:
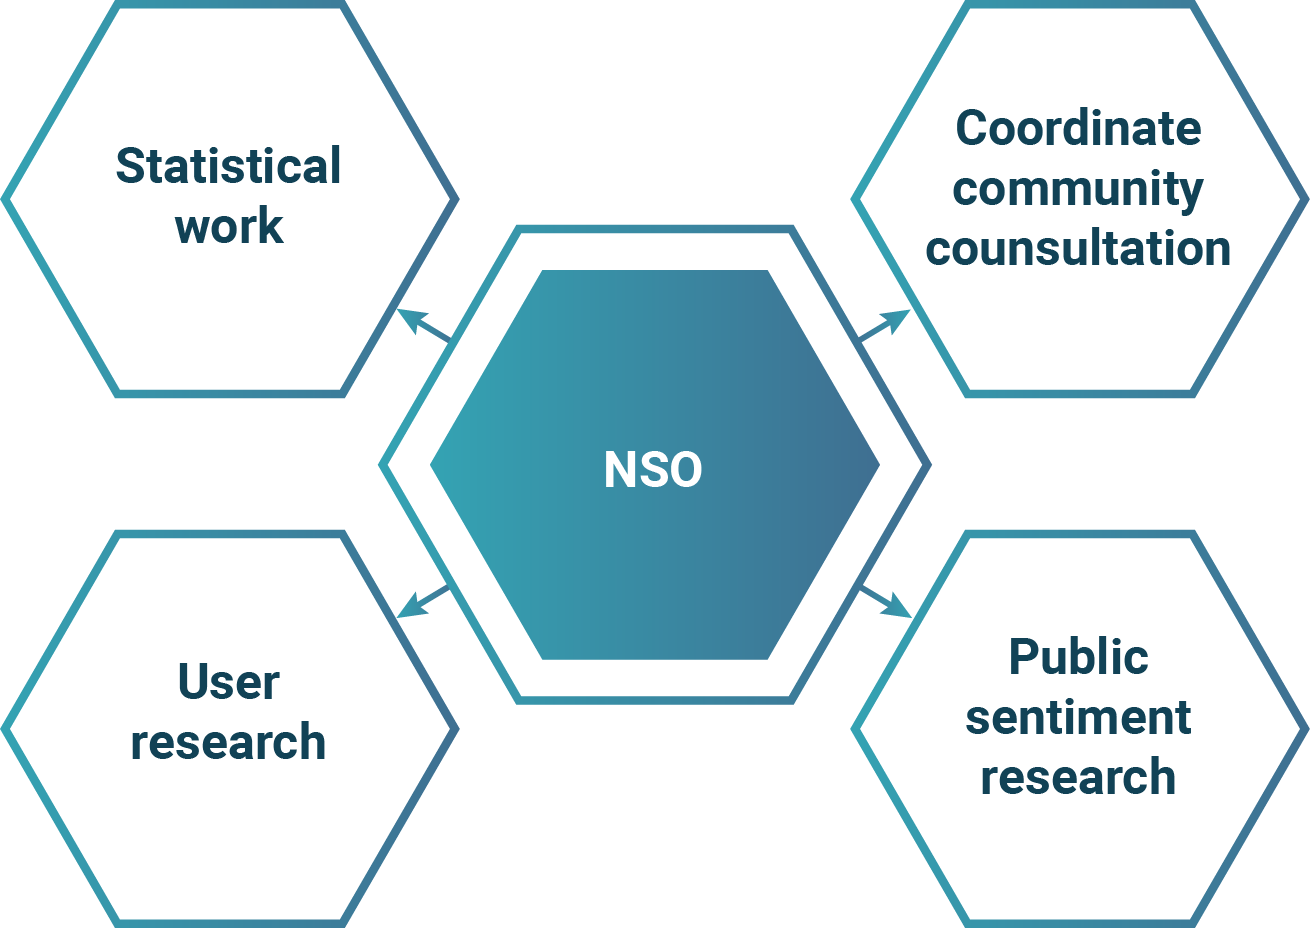
Having a unit responsible for relations with users can help an NSO improve response to the needs of different categories of users. Although many NSOs do not have sufficient capacity for such a unit, they may still initiate or coordinate the implementation of such activities. Such units or activities may be used to coordinate community consultation, public sentiment research and user research, to survey the views of stakeholders and measure their satisfaction levels. User service is part of all statistical work, as statistics are intended for use, and their relevance and ease of use should be a key consideration. Users may also request expert support for the use and interpretation of statistical data. It is key to maintain constant interaction with users.
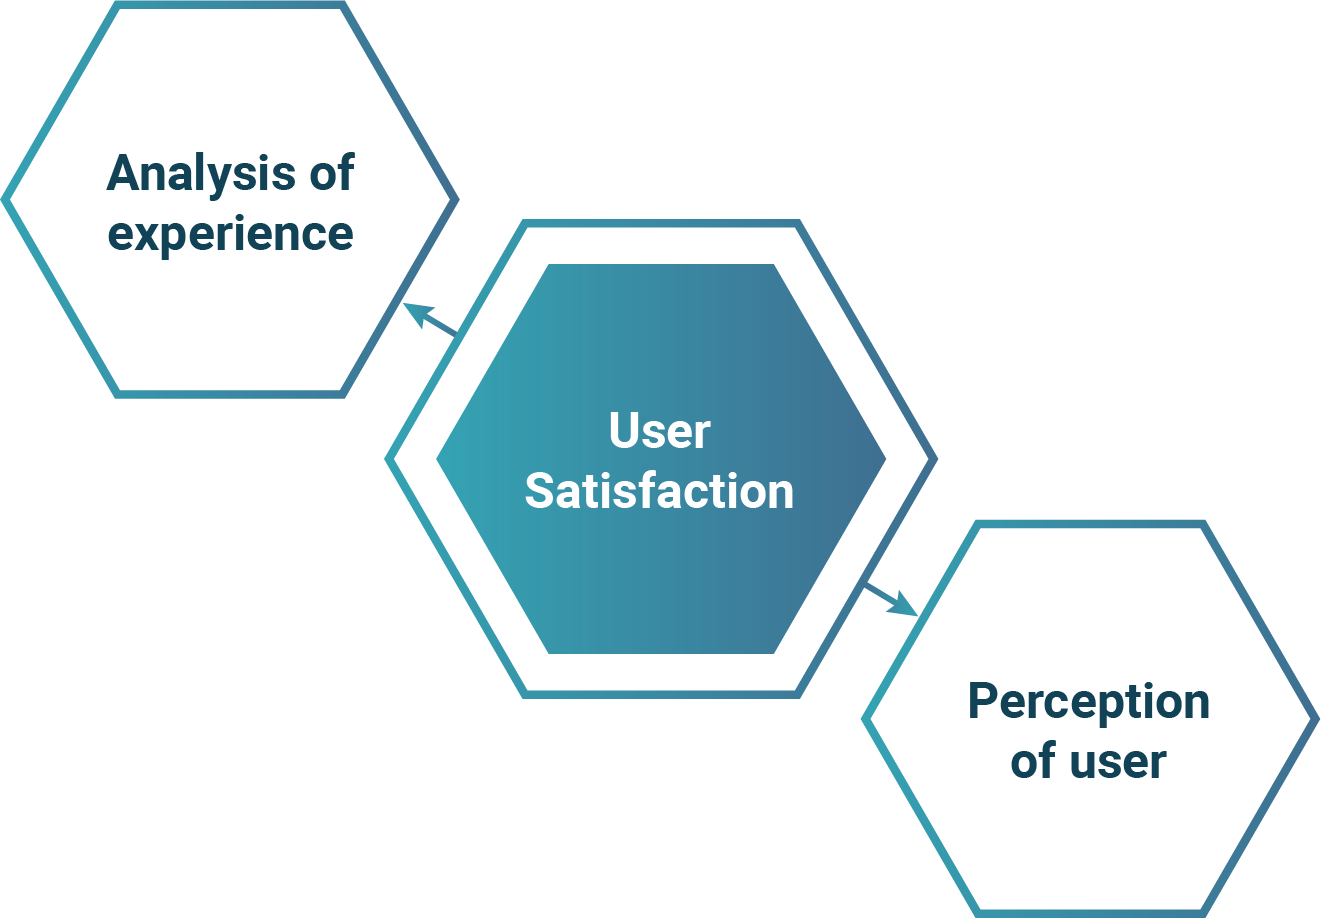
To ensure relevance, the focus should be on analysing the experiences and perceptions of users, to gauge whether the statistics they are looking for are available at the right level of detail, of sufficient quality and in the right format. An NSO should evaluate the number of users, how they use statistics, how useful the statistics are for them. Efforts should be made to discover why potential users are not using official statistics, whether they are not aware of the statistics, or if they are not in the right format or timely enough. It is important to understand what kind of statistics people are looking for, what it is they actually need and value.
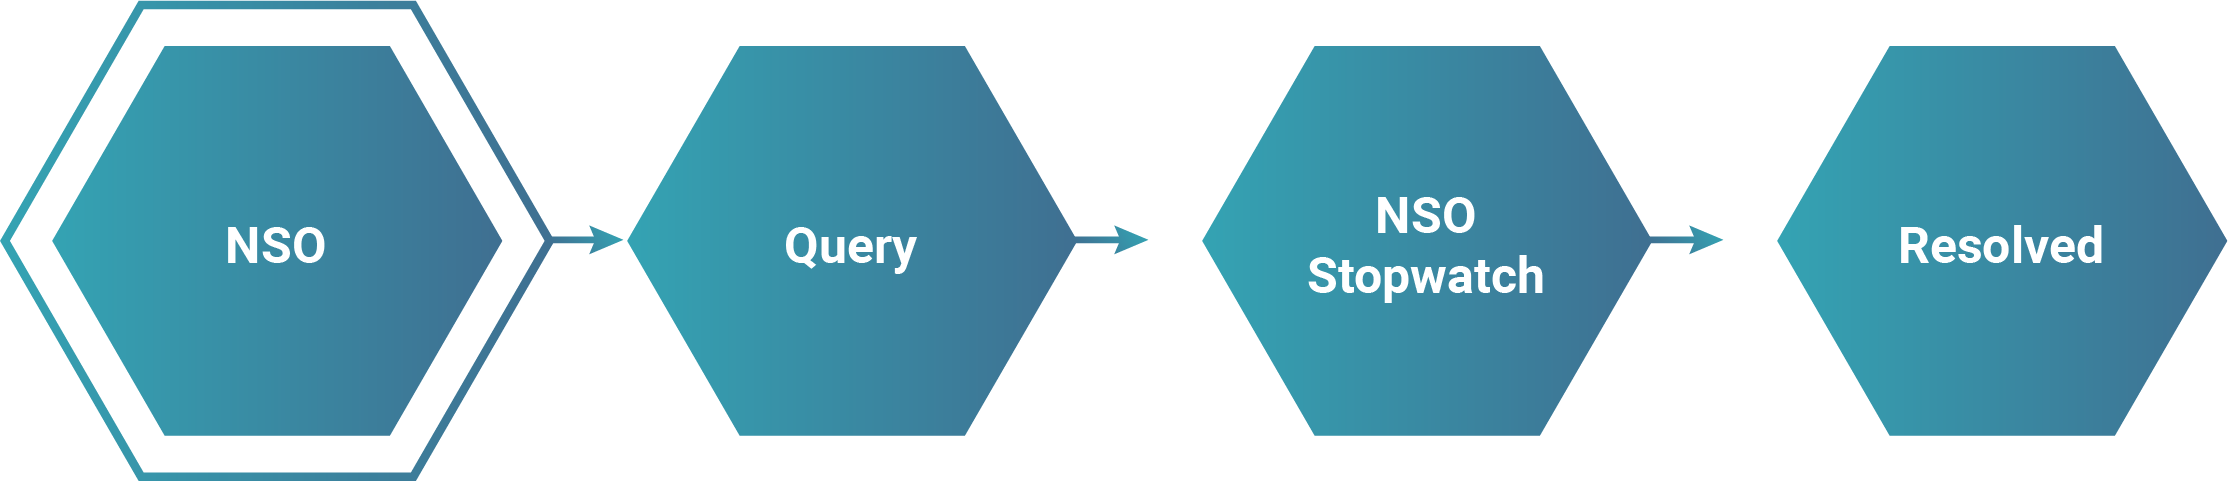
Depending on the capacity of the NSO, there may be a published commitment to respond to a query within a given time period as is the case where the government has an open data policy. In some instances, a query may require the involvement of a subject specialist for a technical request and such special queries would usually require a longer response period.
User satisfaction surveys coordinated across the NSS can avoid duplications, save time and costs.
User Survey (🔗) of the Turkish Statistical Institute (TurkStat) 2020.
UNECE (2018) Recommendations for promoting, measuring and communicating the value of official statistics (🔗).
Statistics Portugal Quality assessment of user satisfaction (🔗).
National Institute of Statistics of Rwanda User Satisfaction Survey 2018/2019 (🔗).
INE (Spain) User satisfaction survey (🔗).
UK Office of National Statistics - exploring the user need for statistical coherence (🔗).