9.2 Sample surveys and censuses#

The Generic Law on Official Statistics (GLOS), UNECE (2018) defines a statistical survey as ‘the primary collection of individual data from respondents of a given population carried out by a producer of official statistics exclusively for statistical purposes through the systematic use of statistical methodology’.
Two approaches used to collect information directly from respondents in different circumstances are sample surveys and censuses. A sample survey is a data collection activity involving only a part (sample) of the total population, while a census is generally a study of every unit (everyone or everything) in a population. Censuses are often referred to as a complete enumeration or a complete count. Both approaches are used to draw conclusions about the whole population. Censuses and sample surveys are complementary in a statistical system. They are each considered to be a special case of a survey.
Censuses are the oldest of statistical activities that serve to make a snapshot of the whole population. Due to their complete coverage population censuses are the most broadly known activities of an NSO and are usually the first association that comes to non-statistician mind when thinking about official statistics. Many materials are available that deal with the management of a census of population, including detailed reports on actual experiences of census-taking. The United Nations Statistics Division has developed a series of handbooks and guidelines to assist countries in their preparation for population censuses. These include:
Guidelines on the Use of Electronic Data Collection Technologies in Population and Housing Censuses (2019) (🔗);
Handbook on Geospatial Infrastructure in Support of Census Activities (2009)
(🔗);Handbook on the Management of Population and Housing Censuses, Rev. II (2016) (🔗);
Handbook on Population and Housing Census Editing (2009) (🔗);
Measuring the Economically Active in Population Censuses: A Handbook and Collection of economic characteristics in population censuses: technical report (2010) (🔗);
Principles and Recommendations for Population and Housing Censuses, Rev. III (2017) (🔗).
Due to the availability of extensive high-quality and up-to-date UN materials, population and other censuses are not discussed in detail in this handbook.
Apart from population censuses, NSOs conduct other exhaustive enumeration activities in order to gather characteristics and data on the size and structure of housing, economic units, buildings or farms.
Due to their complete coverage of the target population, those activities are most commonly also called censuses. Economic censuses are particularly useful when other reliable statistics (particularly about the structure of the economy) and reliable register and administrative information are not available. See Chapter 12.5 — Statistical farm register and other frame sources for agricultural censuses and surveys for more information on agricultural censuses, and also, on the webpage of the FAO World Programme for the Census of Agriculture (🔗).
With the advent of the sample theory, censuses have gained additional purposes as they have become a source of information for sampling frames and the basis of estimators for sample surveys. This has led to a reduction of both cost and response burden, thus enabling a more detailed and more frequent data collection. Data from sample surveys are usually more complex than the basic data collected through a census. Surveys are often used to expand on the characteristics of census topics (and add additional topics) and to measure change between censuses. Choosing a right approach may depend on the characteristics of the population and other factors that are discussed below.
The Australian Bureau of Statistics lists the following advantages and disadvantages of Sample Surveys compared with Censuses (🔗).
Pros of a CENSUS |
Cons of a CENSUS |
|---|---|
- provides a true measure of the population (no sampling error) |
- may be difficult to enumerate all units of the population within the available time |
- benchmark data may be obtained for future studies |
- higher costs, both in staff and monetary terms, than for a sample |
- detailed information about small sub-groups within the population is more likely to be available |
- generally, takes longer to collect, process, and release data than from a sample |
Pros of a SAMPLE |
Cons of a SAMPLE |
- costs would generally be lower than for a census |
- data may not be representative of the total population, particularly where the sample size is small |
- results may be available in less time |
- often not suitable for producing benchmark data |
- if good sampling techniques are used, the results can be very representative of the actual population |
- as data are collected from a subset of units and inferences made about the whole population, the data are subject to ‘sampling’ error |
- decreased number of units will reduce the detailed information available about sub-groups within a population |
Detailed census information on small area populations is used to design sampling frames and selections for the survey units. While survey programmes may collect different information from the census, several topics are usually common to both. Therefore, to maximize the usefulness of the data from both sources, it is important to standardize concepts and definitions. Standardisation also enables uses of modern approaches, such as small-area estimation which allows the creation of estimates for survey results on spatial levels that are unreliable by using traditional approaches. Small area estimation is a procedure where survey data is combined with census data, or administrative records and survey results are then, according to common characteristics, modelled for every respondent in the entire population. This approach allows the creation of econometric estimates of survey results on otherwise unreliable spatial levels. An example of this approach in official statistics is the estimates of poverty at county level (usually level 3 of the territorial classification) from a survey that is representative at municipal level (usually level 2 of the territorial classification) level.
9.2.1 Description of survey functions#
A survey is the most commonly used data collection mechanism in official statistics, it is versatile, relatively cheap and fast (at least when compared to the census), can answer a wide variety of questions about various characteristics of a population and is used in almost every statistical area. It is usually motivated by the need to study the characteristics of a population, build a database for analytical purposes or test a hypothesis. Surveys are therefore usually used as a method of decision-making support in private companies and in government, and as an important part of the scientific method in research activities. It is important to note that surveys in official statistics are also used to make international comparisons. NSOs ensure international comparability of survey results by applying a common methodological framework, by using similar methods and procedures and by monitoring the quality of processes and results through quality management systems and quality assurance frameworks (see Chapter 8 - Quality Management).
Surveys can be used to provide relevant insights about most questions, but statisticians should clearly communicate that surveys are a tool for aggregating the results from the population and that asking technical questions to the general public may not always give relevant answers. The key to a successful survey is a well-defined set of questions than can be realistically answered by a defined population. When planning a survey, it is important to find a balance between satisfying user needs and avoiding undue burden on respondents.
9.2.2 Survey types#
Surveys are versatile instruments that can be used for various purposes. They are the basis of any statistical programme and alongside censuses and processed administrative information form the foundation of official statistics. Surveys can be cross-sectional and longitudinal.
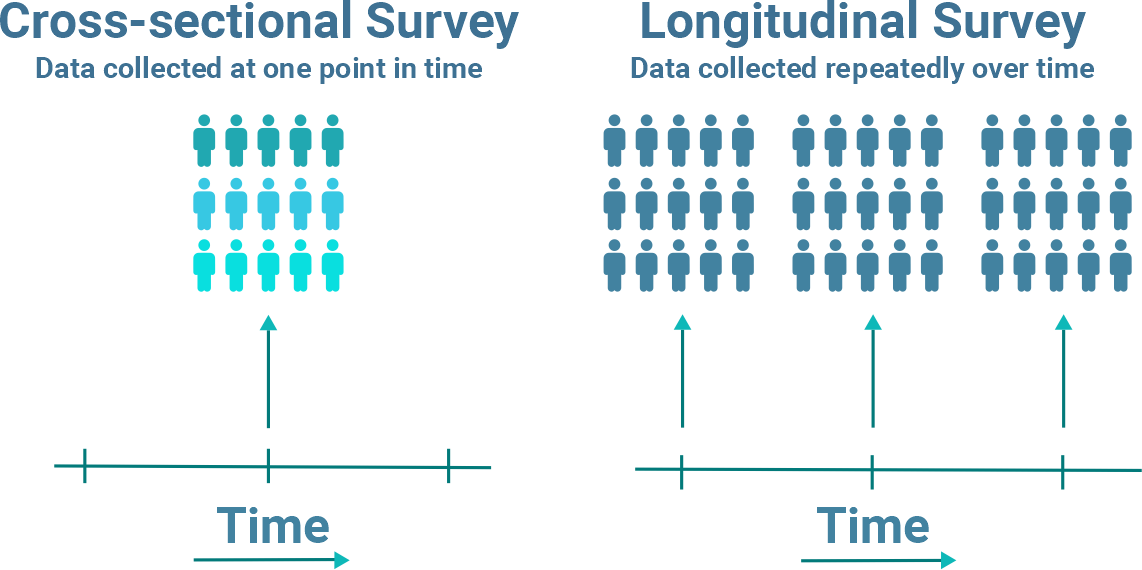
Cross-sectional surveys are those in which a fresh sample of respondents is interviewed each time they are carried out, and they are therefore best served to measure the prevalence of a characteristic within the population. Longitudinal surveys are those that follow the same sample of respondents over time and therefore are best served to measure the incidence of a characteristic.Statistical surveys are usually grouped into statistical domains referring to particular populations. They may also be divided by type of observation unit into two main categories – household surveys and business surveys. Some surveys are a combination of both categories, for example, agricultural surveys, which can be both household and establishment surveys.
Household surveys
Household surveys are the basis of social research and are used to determine the basic characteristics of the population (people). The topics cover many socio-economic areas, including poverty, health, education, employment, gender equality, food security and access to services.
Household is a basic residential unit in which economic production, consumption, inheritance, child-rearing, and shelter are organized and carried out. The classification of ‘household’ is broader than the classification of ‘family’ since family refers only to a group of people related by blood or marriage, such as parents and their children only.
A ‘Household Survey’ is the process of collecting and analysing data to help us understand the general situation and specific characteristics of individual household or all households in the population.
Two types of questionnaires are usually used for household surveys: a) household rosters; and b) detailed (or individual) questionnaires. A household roster includes listing of all household members and their characteristics, such as each member’s age, sex, relationship to the head of household, education and literacy status, employment activity, schooling status (for the population aged 5-24) and marital status.
A detailed (or individual) questionnaire explores the main theme of the study. This questionnaire is usually only completed by specific respondents, such as the head of household, married couples, and mothers of children under five, out-of-school children, or disadvantaged children, etc. As it has to yield reliable results for the whole population, such a survey requires a substantial number of respondents and therefore tends to be quite expensive to administer. It may be carried out as frequently as monthly, or only occasionally, depending upon how quickly the data being collected are likely to change value and, on the budget, available for conducting the survey.
Business surveys
Business surveys are the basis of economic research and are used to determine the basic characteristics of enterprises and the economy. They can be divided into short term and structural surveys. Short term business surveys serve to determine the change of output within an industry or phenomena between measurement periods and are used for tracking the business cycle. They are conducted monthly or quarterly if resources permit, otherwise less frequently according to the budget available.
Short term business indicators usually cover production, turnover, hours worked, number of people employed, wages, exports and imports and producer and import prices in various sectors such as industry, construction, trade and services. Structural business surveys, on the other hand, are usually performed annually or less frequently and are aimed at providing detailed information about the structure, type of activity, competitiveness and performance of economic activities within the economy or a sector. While structural business surveys are mainly used for the compilation of the annual national accounts, short term monthly or quarterly business surveys measure change and therefore provide input for assessing volume change in the quarterly national accounts.
Ideally, every business survey uses the statistical business register as the source of the survey frame (as further detailed in Chapter 12.3 — Statistical Business Register). According to the statistical unit used a business survey may be an enterprise survey or an establishment survey.
Enterprise business surveys. According to Eurostat’s glossary of statistical terms (🔗), an enterprise is an organizational unit producing goods or services that has a certain degree of autonomy in decision-making. An enterprise can carry out more than one economic activity, and it can be situated at more than one location. An enterprise may consist of one or more legal units.
A legal unit may be a natural person or a legal person whose existence is recognized by law independently of the individuals or institutions which may own it or of which it is a member. Examples are general partnership, private limited partnership, limited liability company and incorporated company. Most enterprises consist of one legal unit. However, in many countries, the few enterprises that comprise more than one legal unit account for a huge part of the economy in terms of employment or value-added.
A legal unit may own a second legal unit and this second legal unit may carry out activities solely for this first legal unit. Both units may even have the same management. In this case, they are seen as one single enterprise. Another example may be that legal unit C employs the staff, and legal unit D owns the means of production like machines and buildings. A third legal unit E may own and manage these two legal units. Only the units C, D and E together can produce something and hence are to be counted as one enterprise. The reasons for splitting the organizational unit enterprise into more than one legal unit can be manifold: avoiding taxes or liabilities, different salaries according to the collective wage agreement or avoiding the publication of annual reports are among them.
Globalisation has contributed further to more complex structures of enterprises. Being active on the market in a country often requires an enterprise to have a legal unit in that country. The legal units of such an enterprise may be centrally managed from one country; book-keeping may be carried out centrally from another country; research and design may be done in a country with high wages, and; parts of the production in countries with low wages. Multi-national enterprises are often very large enterprises with a huge impact on statistics in terms of employment and value-added. Thus, good quality multi-national enterprise data is crucial for good quality business statistics and necessitates a stepping-up of the collaboration among the various national statistical authorities. This collaboration is often performed via profiling, a process to delineate complex and large enterprises.
Establishment business surveys. An establishment is an enterprise or part of an enterprise that is situated in a single location and in which only a single productive activity is carried out or in which the principal productive activity accounts for most of the value-added. Establishment surveys are any surveys where data is collected from local units. Data collection for each local unit is often difficult as it poses a significant burden for both respondents and the NSO. Due to this fact, the number of establishment surveys is often limited. However, as establishment surveys provide accurate and detailed information on the lowest level, performing them is important for the quality of national accounts. When an establishment survey is not available for a particular statistical area, data from an establishment survey that are available (usually employment and wages) may be used to derive estimates for other variables.
9.2.3 Types of statistical units that can be subject to the survey#
The Generic Law on Official Statistics (GLOS) defines ‘statistical unit’ as a bearer of statistical characteristics. It is the basic observation unit. According to UNECE Common Metadata Framework (🔗), statistical units are entities, respondents to a survey or things used for the purpose of calculation or measurement. They are units of observation for which data are collected or derived. They may be, amongst others, businesses, government institutions, individual organizations, institutions, persons, groups, geographical areas or events. They form the population from which data can be collected or upon which observations can be made.
UNSD publication Statistical Units (2007) (🔗) offers a distinction between statistical, collection and reporting units. It defines a collection unit as the unit from which data are obtained and by which questionnaire survey forms are completed. With this definition, a collection unit is more of a contact address than a unit. For example, a questionnaire may be completed by a central administrative office or an accountancy firm that provides this service to its client (the observation unit). Such information providing entity is a termed a collection unit.
A reporting unit is a unit about which data are reported. Reporting units are those entities for which information is collected by means of questionnaires or interviews. In most cases, reporting units coincide with the units for which statistics are compiled, i.e., observation units.
According to International Standard Industrial Classification of All Economic Activities (ISIC) Rev. 4 (🔗) statistical units in economic statistics can be divided into the following categories:
enterprise;
enterprise group;
kind-of-activity unit (KAU);
local unit;
establishment or local kind-of-activity unit;
homogeneous unit of production.
9.2.4 Survey design#
Survey design is typically an iterative process that identifies the target population and assesses the sources available to provide the survey frame.
The survey frame comprises the list of units that most closely match the target population and the data needed, first, to stratify these units for sample selection and, second, to identify and contact the selected units. Thus, as further detailed in Chapter 12 - Common Statistical Infrastructure, the frame contains names, and other data need for the identification (identification data) such as addresses, telephone numbers and e-mail addresses (contact data) as well as other metadata used for stratification and sampling.
Specifying population and constructing sampling frame
The choice of survey frame may lead to a definition of a survey population that is different from the target population – i.e., persons with non-permanent addresses or enterprises with 0 employees being excluded from the survey, but it can also affect the methods of data collection, sample selection and estimation, as well as the cost of the survey and the quality of outputs. Further, the surveyed population might exclude areas with extremely high collection costs (such as a remote island) if they cover an insignificant portion of the target population. There are two main categories of frames: list and area frames. A list frame is a list of all units in the survey population, while area frame is a special kind of frame with a hierarchy of geographical areas as units. A typical household survey uses both types of frames as sources for sample selection (Multi-stage sampling), where first a sample of regions are selected from the area frame and then a systematic sample of dwellings (usually stratified) are selected form each of the selected regions.
In official statistics, the survey frame (which is called sampling frame in sample surveys) is usually derived from statistical registers or censuses, but various administrative registers are also increasingly used for this purpose (independently or as a method of improving the frame quality).
Using a consistent survey frame is recommendable for surveys with the same target population or a subset of the target population. When the same sample frame is used for different surveys, it is termed a master sample frame or master sample. In this approach, the first stage of sampling (selecting the areas), for household surveys, is often performed once for all conducted surveys, while the final selection of households is performed for each specific survey. This avoids inconsistencies across surveys and reduces the costs associated with frame maintenance and evaluation. More information on master samples can be found in Chapter 12.7.1 — Household master sample. Having a reliable survey frame is essential to any survey, and thus the nonexistence of a reliable frame can lead to choosing a census (based on area enumeration) rather than a sample survey.
Types of sampling
The two main types of sampling are probability sampling and non-probability sampling. Probability sampling describes procedures where every unit in the population has a chance of being selected in the sample, and this probability can be accurately determined. Non-probability sampling is any sampling method where some elements of the population have no chance of selection, or where the probability of selection can’t be accurately determined. Non-probability sampling is of limited use for surveys conducted by NSOs since the biased selection of units may lead to false conclusions about the survey population as the findings cannot easily be generalized to the population. However, there are statistical areas where a non-probability sample is useful – such as short-term business statistics, where cut-off sampling is often used. Cut off sample is a method in which all units above a certain threshold are surveyed. However, a non-probability sample can be useful for exploratory studies or during the development phase, such as a pilot survey.
Probability sampling should be used when inferences about the population are to be made based on the survey results. In a probability sample, every unit on the frame has a non-zero probability of being selected, and the units are selected randomly. As a result, the selection is unbiased, and it is possible to calculate the probabilities of inclusion, calculate the sampling variance of estimates and make inferences about the population. The main disadvantage of probability sampling is that it requires more time and is more costly than non-probability sampling. It also requires a high-quality sampling frame and at least one sampling specialist within the NSO.
Sampling designs
There are various methods and types of statistical sampling designs.
Selecting the appropriate and effective design depends on the nature of the available sampling frame and the material costs, time allocated for implementing the survey and the nature of the complexity of the sampling units.
Sample design can also influence the required sample size, and thus it has a significant influence on the total cost of data collection. The simplest probability sample designs are simple random sampling and systematic sampling, which result in equal probabilities of inclusion. More complex designs that can result in unequal probabilities of inclusion and most of which require auxiliary information include stratified, probability-proportional-to-size, cluster, multi-stage and multi-phase sampling. Unequal probability sampling designs are typically used to reduce the cost of sampling and the data collection cost. When deciding between the various possible designs, the first thing to determine is what designs are feasible given the survey frame, units in the survey frame, domains of interest, response burden, data collection method, budget, international experience and support, etc. More information on sample design and sample selection can be found in Chapter 12.8.2 — Sample design and estimation.
9.2.5 Data collection and capture modes#
Selecting an appropriate method of data collection is essential to the success of the survey. The data collection method should be chosen to achieve a large coverage, high response rate, and gather accurate information while minimising collection burden and having a reasonable cost. All of these cannot be achieved simultaneously and therefore selecting the right approach out of many available options is usually specific to a particular survey. According to Survey methods and Practices (2003) – by Statistics Canada (🔗), data collection methods can be divided into Self-completion and Interviewer assisted methods.
Self-completion
With self-completion, the respondent completes the questionnaire without the assistance of an interviewer. There are different ways a questionnaire can be delivered to and returned by a respondent. It can be done by post, facsimile, electronically or by an enumerator. When paper-based, this method is called Paper and Pencil Interviewing (PAPI); when computer-based it is called Computer-Assisted Self Interviewing (CASI); Computer-Assisted or Computer Assisted Web Interview (CAWI).
The main advantage of self-completion over other methods is that it is cheaper than interviewer assisted methods and much easier to administer. Self-completion is also useful for sensitive issues since the questionnaire can be completed in private without an interviewer’s presence.
The disadvantage of self-completion is that response rates are usually lower than for interviewer-assisted methods since there is no pressure for the respondent to complete the questionnaire. Also, the quality can be worse than for interviewer-assisted methods since the respondent may misinterpret questions or skip some of them. For this reason, self-completion often requires follow-up after collection to correct errors and omissions.
Three methods of self-completion are commonly used:
Self-completion using paper questionnaire
Paper questionnaires were up to a few years ago, the most widely used method of data collection. Due to its relatively low cost, a self-completion paper questionnaire was mainly used in large-scale data collection operations, censuses, and recurring surveys such as monthly or quarterly business surveys and household budget surveys. This method is often slow, yields rather low response rates, and requires follow-up reminders and clarifications. Even though NSOs have significantly reduced the number of paper questionnaires in recent years, they are still widely used in less advanced NSSs. Questionnaires can be delivered and sent back via mail, via facsimile, delivered or picked up by interviewers, or a combination of these options. A self-completion paper questionnaire sent and returned via mail is certainly the slowest data collection method. Furthermore, self-completion using paper questionnaire also requires data entry, which must be performed manually or checked manually after optical character recognition (OCR). It can be argued that web interviewing may be cheaper and faster in some cases, but it depends on the access to the internet among the population and in particular among the sub-population-group that the survey aims to target.
Self-completion using electronic questionnaire
In recent years, many statistical offices have replaced most of their paper questionnaires with electronic questionnaires. Electronic questionnaires are often made available through an encrypted and password-protected access system. This method is often called CAWI (computer-assisted web interview). For statistical offices, the main advantage of CAWI over paper questionnaire is eliminating the manual data entry, since this is done directly by the respondent. Furthermore, electronic questionnaires provide the ability to integrate logical controls to prevent errors and enforce answers.
A disadvantage of electronic questionnaires is the inability to distribute forms electronically, as countries seldomly possess a comprehensive list of e-mail addresses or official digital mailboxes for every person, household and business. Therefore, the most common way of introducing electronic questionnaires is to mail out the initial login information and require respondents to provide their respective email addresses. Even though the collection process is much faster, and the quality and completeness of the collected data are superior to paper questionnaires, high response rates should not be expected. Follow-up reminders to complete the questionnaire are often necessary but can be foreseen in the design phase of the data collection and automated. Self-completion using electronic questionnaire is currently the most common method of data collection in reoccurring business surveys.
Machine to machine transfer
Although machine-to-machine transfer may be classified as a new and separate data collection method, it has many self-completion survey characteristics. A machine-to-machine transfer is an automated transfer of information from an IT system of the respondent to the data collection system of the NSO. The initial setup of the recurring data transfer has to be agreed with the respondent, who provides access to predetermined sets of information in predetermined collection periods, through a predetermined communication method. The process is usually done by writing a manually or automatically run script that sends the data through the application programming interface (API) that the statistical office opens. There are examples where accounting software providers have automated statistical reporting for businesses by writing scripts that automatically prepare the requested data, which is then automatically uploaded to the data collection website. This method’s main advantage is that it eliminates the reoccurring response burden on businesses and that it is the fastest method of data collection. The main disadvantage is its costs, as preparation and documentation for APIs can be costly. It requires IT staff’s direct involvement on both sides and often requires persuasion to be widely deployed among businesses. A machine-to-machine transfer may also be used to transfer information on reporting units from collection units (such as accounting firms) or for accessing Big Data sources.
Interviewer assisted data collection
The interviewer-assisted methods’ main benefit is that the interviewer can increase the response rate and the overall quality of the collected information by personalising the interview and interpreting questions and survey concepts.
Interviewer-assisted methods are particularly useful for surveying populations with low literacy rates or when the concepts or the questionnaire are complex, or at any time self-completion would be difficult. Specific cases for which interviewer assisted methods are preferred are surveys to collect information about sensitive topics such as violence against women surveys or gender-based violence surveys. In these cases, special protocols are developed and followed. An interviewer can increase the response rate by showing official identification and stimulating interest in the survey and reassuring the respondent of any concerns he or she might have regarding privacy and confidentiality, and the survey’s purpose. The interviewer can prevent errors by immediately identifying and correcting them in the presence of the respondent.
Some disadvantages of interviewer-assisted methods are that they are expensive and difficult to manage. Some of the expenses may include interviewer salaries, interviewer training, transportation and lodging costs for interviewers or office space and telephones in the case of centralised telephone interviewing. The main problem with personal interviews is that it may be difficult to locate the respondent, so the interviewer may be required to make several trips before successfully contacting the respondent. Other disadvantages of interviewer-assisted methods are that poorly trained interviewers can induce response errors, and respondents may be reluctant to answer questions about sensitive topics. If well-trained interviewers are unavailable, other methods of interviewing may be preferable.
Three methods of interviewer assisted interviewing are most commonly used:
Computer-assisted telephone interview (CATI)
Computer-assisted telephone interview (CATI) is a method of interviewer assisted data collection where information is gathered over the telephone and directly imported into the computer system. Telephone interviews offer reasonable response rates at a reasonable cost. Telephone interviews are faster and cheaper than personal interviews since there is no travelling and associated costs. Less time is wasted for contacting the respondent, and quality control of the interviewing process can be easily implemented since telephone interviews can be easily monitored. The disadvantage of telephone surveys is that they are limited by the length of the interview and complexity of the questionnaire, as respondents have less patience for long, complex interviews over the telephone than in person.
Usage of mobile phones has also influenced telephone interviewing by increasing costs as calls to mobile lines tend to be more expensive than calls to landlines and has made the preparation phase, particularly constructing a survey frame with good coverage much more difficult and complex. Further, it has somewhat decreased the response rates as mobile phone users have the caller ID feature enabled by default and are less likely to answer calls from unknown callers than landline users. This drawback can be mitigated if a communication and awareness campaign is carried out just before the survey, but a letter announcing a phone call for the survey can also be a good solution. Further, CATI is an excellent data collection method for reoccurring surveys and follow-ups, where the respondent has already provided reliable contact information and has consented to respond. There are many examples where the initial contact is done in person via CAPI, and further data collection is done via CATI (either by the interviewer who performed the initial collection or through a call centre).
Technological developments like speech synthesis and natural language recognition combined with Artificial Intelligence (AI) systems have been tested to collect information from respondents via telephone (example can be found here). Such technologies can be used particularly for simple and recurrent surveys. However, it is expected that more complex surveys could be conducted through fully automated telephone assisted interviews soon. More information on the potentials of AI systems can be found in Chapter 15.2.15 — Artificial Intelligence.
Personal interviews using paper questionnaires (PAPI) A significant advantage over self-completion using paper is that, if the interviewers have been properly trained and selected for good quality handwriting, accuracy and completeness of the responses can be significantly improved and more readily captured using optical character recognition (OCR). However, personal interviews using PAPI are being gradually replaced, when possible, with computer-assisted methods. In many countries, in particular less advanced ones, the PAPI is widely used for the population and housing censuses.
Computer-assisted personal interview (CAPI) Computer-assisted personal interview (CAPI) combines the advantages of interviewer and computer-assisted methods by speeding up data collection, enabling more complex skip patterns, automating editing and quality checks, and closely monitoring and managing the interviewing staff. CAPI systems can be designed to generate management reports on the status of the interviews (e.g., response rate, number of interviews completed, number outstanding, length of time per interview, etc.), which help quality monitoring survey management.
A significant advantage of CAPI methods is automatically collecting additional data (such as geolocalisation) and metadata (such as time of interviewing), which can be used for data linking and controlling the interviewers. The main disadvantage of the CAPI method is the cost of the equipment and the fact that interviewers must be trained and comfortable using the computer and the data collection application. Therefore, using CAPI may not prove to be the ideal solution for surveys with a large number of interviewers or surveys with a high rate of interviewer replacement.
The computer may be a laptop, tablet, or even mobile phone; the latter two devices are smaller, consume less power, and have a significantly better battery life which are important factors for the interviewers’ autonomy. However, input through touch screens is generally slower and less precise than keyboard input to a laptop. Choice of technology is further discussed in Chapter 15.8 — Questionnaire design tools.
Appropriate choice of mode
According to Survey methods and Practices (2003) – by Statistics Canada (🔗), the following issues should be considered when selecting an appropriate method of data collection:
The information available in the survey frame. If the frame does not include mailing addresses, then self-completion questionnaires cannot be mailed to respondents. If up-to-date telephone numbers are not available telephone interviews cannot be conducted.
The characteristics of the target population influence the data collection method. If the literacy rate of the population is low, or if the language is a consideration (i.e., there are two or more language groups), interviewer-assisted methods may be the only option. If the population and sample are widely dispersed across the country, personal interviews may be too expensive and difficult to manage.
The nature of the survey may influence data collection. If the subject matter is sensitive, then a collection method that builds in anonymity such as self-completion or telephone interviews may be the most appropriate. If complex questions are asked, an interviewer may be needed to explain questions and concepts. If the interviewer needs to make observations or measurements (e.g., administering a literacy test to children) or showing the respondent material (e.g., graphics or diagrams), personal interviews might be required.
Available resources heavily influence the choice of the data collection method. These resources include available budget, personnel, equipment and time. To use an interviewer-assisted method, sufficient budget must be available to pay for the training, hiring and travelling of interviewers. The national statistical office also needs to be able to find the required number of interviewers. If a computer-assisted method is selected, then IT experts are required along with the necessary computer equipment.
Data quality requirements should be considered when selecting a data collection method. Well-trained Interviewers in the concepts being used in the survey can reduce response errors and nonresponse. Precision requirements should also be considered: larger samples generally yield more precise estimates, but this is the more expensive data collection method.
Selecting the appropriate method is usually survey specific, and alongside factors mentioned above, often depend on the corporate culture and the survey manager. Some survey managers are reluctant to innovate, while others are actively seeking new methods. It is certainly necessary to promote new practices and encourage the modernisation of survey methods, typically for those representing the highest costs and the highest burden on respondents.
In summary, personal interviews are often the most expensive method and self-completion surveys the least expensive. Using computer-assisted methods increases quality and improves speed, but may sometimes increase costs. The ability to measure quality and implement quality control procedures may also be important. It is easier to monitor the quality of telephone interviews than personal interviews. However, the most efficient solution may be a combination of different methods. This approach is often referred to as the mixed-mode data collection. Mixed-mode is particularly useful for surveys which require multiple interviewing of the same respondents. The mix-mode method may start with the interviewer’s visit who informs the respondent, answers the questions, and collects the first set of requested data. After this first visit, further data collection could be processed information could be collected via CAWI or CATI methods. Mixed-mode data collection can also be combined with administrative data to further reduce costs and the response burden.
Questionnaire design
The questionnaire should be designed to minimise possible response errors. This includes standardising the questions, but also standardising the explanations for respondents and interviewers. The questionnaire layout is also important, but it often depends on the method of data collection. The introduction and sequencing of questions starting with questions relevant to the survey topic, but easy to answer can improve respondent participation. Statements that introduce new topics should be used, and the respondent or interviewer’s instructions should be clear, short and easy-to-find. The questionnaire’s general format and design should be assessed for their impact on the respondent and interviewer; including the font, section headings, colour of the questionnaire, format of response categories, and visual aids, etc. Finally, how the questionnaire is to be processed should be considered: it should be designed to facilitate data collection and capture, which is particularly important for paper-based collection.
A draft version of the questionnaire should be tested and revised thoroughly before finalising the questionnaire. Testing can include informal testing, cognitive testing, focus groups, interviewer debriefings, behaviour coding, split-sample tests and a pilot test – methods of testing are described in detail in links provided below.
Designing a good questionnaire is a combination of science, experience and sometimes a bit of art. A well-designed questionnaire collects data efficiently with minimum errors and is at the same time easy to answer and administer, without posing an unnecessary burden to the respondent and the national statistical office. Achieving a good balance between those objectives can be achieved through an iterative questionnaire design process, which includes multiple consultations, reviews, testing and revision.
The process usually starts by examining all the information requirements that must be met, followed by an individual review of each question to find an explicit justification for being on the questionnaire. It must be known why each question is being asked and how the information is to be used. The wording of the question must be clear. The questions must follow a sequence that is logical for the respondent. The questions must be designed so that they are easily understood and can be accurately answered by respondents.
Questions can be of two types: open or closed. Open questions allow for self-expression but can be burdensome and time-consuming as well as difficult to analyse. Closed questions may be two-choice questions, multiple-choice and ranking or rating questions. Closed questions are usually less burdensome for the respondent, and data collection and capture are cheaper and easier. However, a poor choice of response categories can cause response distortion. When wording a survey question, the following guidelines should be followed:
keep it simple;
define acronyms and abbreviations;
ensure questions are applicable;
be specific;
avoid double-barrelled questions;
avoid leading questions;
avoid using double negatives;
soften the impact of sensitive questions;
ensure that questions read well.
Questionnaire design is often performed in coordination with various departments of the national statistical office, and it is often wise to appoint a person (or a unit) to be responsible for the final approval of questionnaires. More information on the tools to support questionnaire design can be found in Chapter 12.8.1 — Questionnaire design.
Statistics Canada - Survey methods and practices (🔗);
Statistics Netherlands - Questionnaire development (🔗);
Statistics Sweden - Design your questions right - How to develop, test, evaluate and improve questionnaires (🔗).
Minimising response errors
Response errors represent a lack of accuracy in responses to questions. They can be attributed to different factors, including a questionnaire that requires improvements, misinterpretation of questions by interviewers or respondents, and errors in respondents’ statements.
One of the common strategies for reducing the response errors is using terminology that is understandable to the respondent, as the language used by statisticians may not be familiar to the respondent (household or business).
Use of electronic questionnaires can also lead to a significant reduction in the number of response errors, as various conditions can be included in questions (i.e., age limit 0-120 for the question about the respondent age, that revenue must be greater than profit, or that the total must be the sum of its parts).
Response errors should be reviewed in the processing phase, and if a common response error is identified, measures should be taken to minimise it in subsequent data collection.
Reducing Response Error in Surveys (🔗).
9.2.6 Processing survey#
Once collected, survey data require additional processing before they are analysed and aggregated into statistical results, and the same is true for administrative data used for statistical purposes.
Processing transforms survey responses obtained during collection into a form that is suitable for tabulation and data analysis. It includes all data handling activities – automated and manual – after collection and before estimation. According to the GSBPM data processing phase is divided into sub-processes that integrate, classify, check, clean, and transform the input data. The focus of this chapter will be on editing, coding, imputation and outlier detection, which are covered in more detail in Chapter 12.8.1 — Questionnaire design.
Editing
Editing is the application of checks to identify missing, invalid or inconsistent entries that point to data records potentially in error. The purpose of editing is to better understand the data to ensure that the final data are complete, consistent and valid. Edits can range from simple manual checks performed by interviewers in the field or administrative clerks for administrative data to complex verifications performed by a computer program. The amount of editing performed is a trade-off between getting every record ‘perfect’ and spending a reasonable amount of resources (time and money) achieving this goal. While some edit failures are resolved through follow-up with the respondent or a manual review of the questionnaire, it is nearly impossible to correct all errors in this manner, so imputation is often used to handle the remaining cases.
Point of collection editing
Point of collection editing is used to detect mistakes made during the interview by the respondent or the interviewer and to identify missing information during collection to reduce the need for follow-up. Editing during collection is considerably easier to implement when it is automated through a computer-assisted collection method. For self-completion questionnaires, respondents may edit their answers. In most interviewer-assisted surveys, editing is performed during the interview. Interviewers are instructed and trained to review the answers they record on a questionnaire immediately after the interview is concluded – either after leaving the dwelling or after hanging up the telephone. This way they still have an opportunity to detect and treat records that failed edit rules, either because the correct information may still be fresh in their mind or because they can easily and inexpensively follow-up with the respondent to ascertain the correct values.
Edits can be carried out automatically by software applications in the case of computer-assisted collection methods. For paper questionnaires with manual data capture, it is economical to use data capture as an opportunity to apply rules to clean the data sufficiently to make the subsequent processing stages more efficient. Generally, editing during data capture should be minimal since responding to an editing failure slows down data capture. Edits during this stage of processing are mainly validity edits and simple consistency edits.
When working with administrative data, it is often useful to suggest to the data provider the inclusion of automated editing rules within the collection systems, as this can lead to a dramatic increase in the quality of the administrative data. Statistical offices should use this as often as possible, as they could directly or indirectly benefit from the increased quality of administrative information.
Primary and secondary editing
The most comprehensive and complicated edits are usually carried out after data collection is completed, and material reaches the office. In some NSOs this process is performed in multiple phases, most commonly referred to as primary and secondary editing. The first phase is usually performed in regional offices, immediately after data collection, when an interviewer can re-contact the respondent and follow up after performing a basic check and identifying an error or inconsistency. More complex edit rules are generally reserved for the separate edit stage after data capture – along with validity edits, more complex consistency edits are often performed along with selective editing and outlier detection.
For edit failures after data collection, the usual procedure is to flag the field that failed an edit and then either impute the field or exclude the record from further processing. Most edit failures at this stage are flagged for imputation. Values that fail an edit should be flagged with a special code to indicate that an unacceptable value or invalid blank was reported. These flags are particularly useful when assessing the quality of the survey data. In some cases, the record or questionnaire may fail so many edit rules – or a small number of critical edits – that it is rendered useless for further processing. In such cases, the record is usually treated as a non-respondent, removed from the processing stream and a nonresponse weight adjustment performed.
Coding
Coding is the process of applying numerical values to given responses to facilitate data processing.
Coding can also be done in the phase of survey design when questionnaires are being prepared. This means that every possible answer is given a predefined numerical value before the questionnaire is administered. It is done as a part of the questionnaire design, and it is quite easy to enforce and administer for closed questions and electronic data collection. Application of statistical classifications to the core data is also referred to as coding. GSBPM provides the following example: automatic (or clerical) coding routines may assign numeric codes to text responses according to a pre-determined statistical classification to facilitate data capture and processing. Some questions have coded response categories on the questionnaires or administrative source of data, and others are coded after collection using an automated process (which may apply machine learning techniques) or an interactive, manual process.
Outlier detection and treatment
An Outlier is an observation or subset of observations that appear inconsistent with the remainder of the dataset.
Outlier detection is performed by analysing the complete dataset and identifying unexpected or extreme values, usually by measuring their relative distances from the centre of the data.
Outliers detected at the editing stage of the survey process can be treated in various ways. In a manual editing system, the outliers are examined or followed-up and corrected if identified as errors. In an automated editing system, replacement values for outliers are often imputed. In some cases, no special treatment of outliers is performed if it is believed that they are not influential.
The following approaches can be used to treat outliers:
change the value;
change the weight;
use robust estimation.
It is also understood that extreme values detected as outliers are not errors - one such example is a sector where there are one large company and many small ones.
More information on outlier determination methods and tools can be found in Chapter 12.8.1 — Questionnaire design.
Imputation
Imputation is a process used to determine and assign replacement values to resolve missing, invalid or inconsistent data.
This is done by changing some of the responses to ensure that a plausible, internally consistent record is created. Imputation is usually performed via a carefully designed automated system, that uses the entire dataset’s characteristics and additional data (if available) to propose the replacement value. Good imputation has an audit trail for evaluation purposes. Imputed values should be flagged, and the methods and sources of imputation clearly identified. The original and imputed values of the record’s fields should be retained so that the degree and effects of imputation can be evaluated.
Although imputation can improve the quality of the final data, care should be taken to choose an appropriate imputation methodology. Some imputation methods do not preserve the relationships between variables or distort underlying relationships in the data, while a dataset that requires a significant amount of imputed values is usually a result of a failure in the survey design. The adequacy of the method chosen depends on the type of survey, its objectives and the nature of the error. More information on imputation principles, methods and tools can be found in Chapter 12.8.1 — Questionnaire design.
Macro-editing
Macro editing, namely, editing on the basis of a review of aggregated data, is a set of strategies that aim to reduce the number of micro-edits and manual checks that the clerks have to perform.
The rational of macro-editing is to provide preliminary results before the editing phase and check the consistency of the results before proceeding to the editing phase.
Macro editing is usually done by performing the dataset analysis and identifying the upper and lower limits of the data that requires verification and perform additional checks based on the importance of the item at the total level. Macro editing can reduce the total cost of editing, as it can be used to prioritise and reduce the verification of the collected data (micro-level).
An overview of macro editing methods can be found here.
Estimation
Estimation is how an NSO calculates estimates that apply to the overall population based on the sample data.
The principle behind estimation in a probability survey is that each sample unit represents itself and a number of other similar units in the surveyed population. Estimation involves assigning a (final estimation) weight to each unit’s response in the sample, where the weight indicates the number of units the sample unit represents in the overall population.
The starting point for determining the appropriate weight of a sample unit is the inverse of the unit’s probability of selection. This depends upon the sample design and is commonly referred to as the design weight. Determining this weight is an important part of the estimation process. The total of the design weights is the size of the population from which the sample was selected. In the case of a multi-stage sample design, the probability of selection is taken over all selection stages. The design weight is then adjusted to produce the (final estimation) weight. The two most common reasons for making adjustments are, first, to account for nonresponse and, second, to improve the estimate’s reliability by using auxiliary data.
Once the final estimation weights have been calculated, they are applied to the sample data to compute estimates. The total of the weights is the total population size estimated from the sample data. Summary measures of the population such as totals, averages and proportions are typically estimated for the characteristics collected from the sample units. These characteristics often referred to as variables in statistical theory, may be qualitative, for example, sex or marital status, or quantitative, for example, age or income. There are various formulae for estimating summary measures depending on the characteristics being estimated and the sample design.
Information on estimation tools can be found in Chapter 12.8.2 — Sample design and estimation.
9.2.7 Respondent relations and communications#
A key challenge of any statistical organization is continually improving relevance and improving and preserving credibility. As the quality of statistical products in many cases relies on the quality of inputs, ensuring respondent cooperation is essential. Methods of ensuring this cooperation are usually divided into two main approaches, often simultaneously used: using legal instruments to force compliance or discourage disobedience and actively communicate and try to appeal to the sense of morality to encourage cooperation.
A statistical organization must earn public trust by treating respondents with respect, not just to reach its statistical goals. It is important to remember that, even in the presence of laws that make response to one or more data collections mandatory, participation by the public in statistical organization is a largely voluntary process. Even when the survey process is not voluntary, a statistical organization should treat respondents in an ethical manner, minimise their response burden, respect their privacy, and maintain the confidentiality they were promised when they provided the information.
In larger NSOs, respondent relations are often centralized into a specialized unit organized within a user communication department, as respondent relations are often similar to handling difficult users. The unit could manage the following tasks:
handling the public relations required for potential respondents to understand why they have been selected, what is asked of them and what is the public good that is served as a result of their cooperation;
exercising special care and taking all the required precautions in cases where the announced survey is either unusually long (for example, surveys of family expenditure) or unusually intrusive (for example, surveys of harmful drug consumption and surveys of fertility);
keeping a register of respondents contacted and survey interviews completed so that recalcitrant respondents can be identified and persuaded to participate;
sharing information with respondents, so that they feel not only that they have contributed to the public good but that there is some personal benefit as well;
accomplishing these tasks requires tact and diplomacy, together with firmness and determination. There will always be people in either the household or the business sector who will refuse to comply, no matter how good a case for cooperation has been put forward.
The following sections will provide examples of good practices in respondent relations and advise how to communicate with respondents.
Use of the law to enforce response
Approaches to this issue differ from country to country. In some, compliance with statistical collection is obligatory - if respondents do not provide information in the form in which it is requested and in a timely fashion, they violate the law. In other countries, some requests for certain classes of information are mandatory and supported by legal requirements, whereas others are made on a voluntary basis. This is probably the most common situation, where the law recognizes a restricted set of compulsory surveys or provides a procedure through which a survey can be made compulsory. If this is the case, statistical agencies usually declare economic inquiries as compulsory and others voluntary. Finally, there are cases where the law is unclear on the subject. When this is true, the statistical organization may be fearful of demanding too much information: if challenged, the court might rule that no information is to be demanded compulsorily, and the resulting publicity might adversely affect response rates. Whatever the legal basis, all agencies find that the most important objective is to secure a cooperative attitude on the respondents, particularly from small businesses and households, as compulsion can rarely alleviate the response problem.
The Generic Law on Official Statistics (GLOS), UNECE (2016);
The Guidance on modernising statistical legislation (🔗), UNECE 2018.
Respondent policy and charter
As noted earlier, maintaining good relations with respondents is a critical factor of success for any statistical organization. As in other areas, standardized, transparent and uniform approach to respondents usually yields best results. An example of good practice is having a clear and easily accessible document, sometimes presented in the form of a respondent charter, that provides basic information to respondents in order to notify them about the general purpose of official statistics, inform them that data collection is necessary because requested information cannot be obtained through other means, and assure them that the information will be kept secure and will remain confidential. This is usually achieved through a dedicated webpage to which respondents are directed via letters or electronic messages accompanying data collection. Respondent charters are particularly useful for business surveys, as they can be used to ensure businesses that the appropriate method of data collection is used and that the response burden is not excessive. Having a respondent charter is a good way of ensuring commitment, as it can oblige the organization respond to any respondent query within a given time period.
Some NSOs also have a dedicated respondent policy unit, with the objectives of helping to raise response rates and ensure that respondents provide information willingly. The staff of the dedicated unit must be equipped to answer questions about the use of the information, the care with which it is handled and the general attitude of their organization. They must avoid the appearance of annoyance and carelessness in quoting from the law and must be fair and consistent in the way they treat businesses and households. If there is a perceived crisis in relations with respondents, the chief statistician is advised to address the matter at his level. Reporting directly to the chief statistician at this level may be a good way to show reluctant respondents the seriousness with which the organization views the matter.
UK ONS - Respondent Charter for Business Surveys (🔗).
Managing key respondents and business profiling
Managing key respondents
Some very large businesses are of particular interest to NSOs due to their large contributions to estimates of the total economy, a particular statistical region, domain, or segment of a classification. Accurate and prompt responses from such businesses are crucial in producing good quality estimates. Assigning a single point of contact within the NSO for a particular business for all surveys can result in big improvements in accuracy and timeliness. For this reason, several NSOs have introduced a special organizational unit, typically called the Large Case Unit or the Large Business Unit, with the exclusive function of managing relations with large businesses.
Such units have proven to be useful as they can gather more detailed information from businesses while at the same time reducing the total burden on the enterprises through a more efficient data collection. Furthermore, such units are particularly appropriate for the conduct of business profiling, which (as further described below) involves tracking the boundaries and structure of large businesses and validating or modifying their survey reporting arrangements. As large businesses are subject to quite frequent changes in boundaries and structure, without such action, reported values may become incomparable over time. Large case units are also important for tracking accounting practices, particularly to distinguish internal transfer pricing and market pricing, which is particularly relevant in tracking multinational enterprises and globalization related economic phenomena.
Business profiling
According to the Eurostat Business Register Recommendations Manual (🔗) profiling is ‘a method to analyse the legal, operational and accounting structure of an enterprise group at national and world level, to establish the statistical units within that group, their links, and the most efficient structures for the collection of statistical data’. The process requires conducting in-depth interviews with senior company representatives to obtain all the company’s relevant financial information, relationships, and structures. Profiling is used to improve the quality of the business register and the quality of all surveys that use it as a survey frame and source of information. More information on business profiling can be found in Chapter 12.3.4 — Statistical sources to supplement SBR content. The main benefit of profiling is having clear delineation of activities within a company that are separated into ‘virtual’ statistical units that can provide a more detailed overview of company activity. Once a company is profiled, it is of paramount importance that data is collected in accordance with the profiled structure, or at least that the procedure of imputing the missing values is defined.
Guide to sharing economic data, UNECE 2020 (🔗);
LCU in Ireland (🔗);
Profiling in European Business statistics (🔗);
Profiling in the Netherlands (🔗);
Minimizing non-response and follow-up procedures
Minimizing non-response
The key to minimising non-response is to reduce the number of non-contacts and refusals. Causes of non-contact depend on the specific survey design. In face-to-face surveys, non-contact can result from the interviewer’s inability to reach the respondent within the prearranged number of contact attempts. Increasing the number of contact attempts not only increases the number of ‘contacted’ and therefore the response rate, but also increases the costs. Alternatively varying the days and times at which contact is attempted also increases the response rate, without significantly affecting the cost. This is done by defining the follow-up procedures in cases of non-contact, usually, if a respondent is not reached within normal operating hours, the second contact is attempted in the afternoon or during the weekend.
Follow-up procedures
In self-completion surveys, non-contacts can be the result of errors in the survey frame. As most statistical surveys use statistical registers as a survey frame, the solution would be to keep the statistical registers up to date by using administrative data. Another solution would be to check the information from the enterprises themselves, usually, through a register survey, that is intended to update the information stored in the statistical register. Further information on frame improvements and statistical register can be found in Chapter 12.3.7 — Producing statistics directly from the SBR. Tools to reduce refusals also depend on the data collection mode used. For instance, interview surveys may use specially trained interviewers to convert refusals, while mail and Internet surveys rely on incentives or special contacts to counteract explicit refusals. When faced with particularly difficult data collections, such as household budget survey or time-use survey (which both require detailed annotation of activities in diary form) statistical agencies often resort to special incentives offered to respondents. These incentives can be monetary amounts, gifts or participation in a lottery with special prises. Ability to organize incentives may depend on local laws and regulations.
Measuring the response burden, individual and total
Many countries are making efforts to measure and reduce the administrative burden on businesses. Even though providing data for official statistics comprises a small fraction of the total administrative burden, NSOs are giving significant focus to reduce the response burden. The time spent on responding to a questionnaire (including the time needed to retrieve the required data and to fill in the questionnaire) is a quality and performance indicator (QPI) that should be monitored for every survey, as further discussed in Chapter 8.5.6 — Monitoring quality and applying quality gates. Even if the questionnaire does not measure the time spent completing the questionnaire, the survey manager can usually provide a reliable estimate based on a desk study or questionnaire testing exercises.
Measurement of the response burden in hours can be translated into monetary terms by multiplying the hours by the average hourly wage in a sector subject to the questionnaire. Multiplying the average response burden by the number of respondents to a survey gives the survey’s total response burden. Summing the figures for all surveys within a year gives an overall annual total response burden imposed by the NSO. Having a list of surveys and their response burdens is useful in setting development priorities for the NSO, particularly those that can lead to the modernisation of data collection activities, through which the response burden can be reduced. Examples are (i) modernisation of a paper-based survey to web-based data collection, and (ii) use of administrative data to reduce the total number of questions within a survey questionnaire or eliminate the survey.
Some NSOs also measure the individual burden of each business respondent and/or flag the respondents of each survey in their statistical business register to momentarily exclude them, if possible, from future survey samples. For household surveys, gradually rotating the sample rather than replacing it can be an effective method of spreading response burden equitably and while at the same time having a longitudinal component in what would otherwise be a cross-sectional survey.
9.2.8 Designing integrated survey programmes#
Although continuous improvements in survey taking can be noted throughout the world, improvements have mainly been focused on improving individual surveys rather than integrating different surveys into a modular and unified collection system.
The result is that the speed of development might be unequal, different frames and their update procedures may be used, sampling, collection and processing methodologies may be different – resulting in unnecessary burden for some respondents (usually large enterprises).
Integrated suite of surveys
A solution to the issues mentioned above is to design an integrated suite of surveys. Integration in the context of survey programmes implies linkages between different surveys or between rounds of a single survey. There are three main objectives of integration: enhancement of survey results, reduction of costs, and reduction of response burden.
Integrated surveys have the following common characteristics:
harmonized concepts and questionnaire content;
use of a common survey frame, such as statistical register, master sampling frame or master sample, as further described in Chapter 12- Common statistical infrastructure; and
adopting generic sampling, collection and processing methodologies, as also further described in Chapter 12 – Common statistical infrastructure.
The approach has been tested in different statistical areas and has proven to be particularly useful, as it leads to a significant reduction in response burden, while at the same time allowing more detailed insights on a lower territorial level. Examples of an integrated suite of surveys can be found in business, social, agricultural and environmental statistics and have been successfully implemented in many countries. Integrated survey programs, particularly those that involve a significant proportion of the overall NSO budget, should be included in strategic plans and carefully planned and evaluated.
FAO - The Agricultural Integrated Surveys Programme – AGRISurvey.
Philippines PSA - ISLE Integrated Survey (🔗).
Statistics Canada - The Integrated Business Statistics Program (🔗).
Statistics New Zealand - Integrated household surveys (🔗).
Toward an Integrated Annual Business Survey System (🔗).
Core survey vehicles and supplementary modules
A usual approach to an integrated survey programme is to introduce a core set of questions addressed to all respondents together with a set of specific modules and/or rotating supplements containing additional questions.
For business surveys, this enables appropriate tailoring of questionnaires by industry using industry-specific modules as well as rotating supplements on topical questions. By utilising this approach, core information (such as the number of employees or turnover for business statistics, or employment status or sources of income for social statistics) can be gathered coherently from multiple sources, thus allowing representativeness at a lower territorial level than could otherwise be achieved without increasing respondent burden.
A similar approach is also used in household surveys, which are often used for multiple purposes. For example, a labour force survey often has a core module and supplementary (ad-hoc) modules used for more detailed inquiries on sub-topics using the same master sample. There are also examples of surveys designed to collect data on multiple purposes comprising loosely connected modules.
Using supplementary modules also enables imputation of missing variables and construction of estimates using small area estimation methods. This approach is particularly useful in combination with administrative information (both in business and household surveys) used for record linkage and further reducing the response burden. It implies that unique identification numbers that enable record linkage should always be collected as further discussed in Chapter 15.2.11 — Linked data.
Responding to urgent requests
One of the comparative advantages of NSOs relative to other data providers is the trust that users have in official statistics. This trust is, amongst other things, built on the accuracy of the data outputs, which, in turn, depends upon the good design and careful execution of statistical processes. Thus, the NSO faces a challenge when confronted with a new and urgent demand for statistics. Being unable to deliver quickly has potentially negative consequences for the NSO. On the other hand, a new and urgent data demand can be an opportunity to gather much-needed resources, tap into a new data source, increase the visibility and/or credibility of the NSO and compete effectively with alternative data providers.
High-profile, urgent requests most commonly come from the government, but may also arrive from international organizations. The NSO should be swift to respond and use the limited window of opportunity to negotiate additional resources allocation. The chief statistician should use his authority to explain to all parties the particularities of statistical data collection.
An NSO should not automatically initiate a new survey in response to every new data demand. Rather, it should systematically explore whether the demand could be fully or at least partly satisfied using regularly collected data or administrative data.
The sense of urgency from the users, typically if the user is the Government, may open new opportunities for accessing new data sources. It should be noted that not all requests have to be accepted by official statistics, particularly those that can be easily obtained from private-sector survey companies.
Although the request might be one-time-only, the NSO should bear in mind that periodicity is an important feature of statistical activities and plan and communicate (to ones that are requesting the data) accordingly. Urgent requests may be disseminated under the ‘experimental statistics’ label if there is no certainty that the effort will be repeated or if the results do not satisfy the usual statistical standards as further elaborated in Chapter 4.5.5 — User access to confidential data for their own statistical purposes.
Flexible survey-taking capability
To respond to urgent new data demands, some NSOs have introduced an organizational unit that can design and conduct a quick survey, either as the first cycle of a permanent new survey or as a one-time exercise. The responsibility for feasibility tests can be assigned to such unit, so that its staff become accustomed to launching quick efforts designed to settle basic questions, prior to what might be a more substantial survey. By developing such a capability and periodically demonstrating its power and scope, an NSO can increase its relevance.
Integrated survey programmes also increase the capacity of an NSO to respond quickly to new requests, as a module or additional questions may be added more quickly to an existing survey rather than setting up an entirely independent data collection.
9.2.9 Survey staff training and expertise#
Successful planning, design, implementation, and evaluation of a survey requires cooperation and coordination of various specialists with different technical skills. Due to their specificities, these skills are often not easy to obtain outside of the statistical system and therefore often have to be developed and maintained internally (more information on options for organizing staff training can be found in Chapter 13 - Human Resources Management and Development). As proper training of survey staff is key to ensuring the quality of statistics, it is important to invest time and training resources. Training also enables standardisation of approaches and should promote process optimisation and use of new methods. Organizing efficient training is particularly important for interviewers, as well-educated interviewers can significantly improve the resulting statistics. Subsections below list the staff expertise and skills for efficient survey taking. Survey teams are usually organized interdisciplinary and are typically composed of a survey manager, an expert in the field of study covered by the survey (a subject matter specialist), a methodologist, a computer systems analyst, and a data collection and operations expert. All members of the survey team plan, manage and coordinate activities within their scope of expertise and responsibilities covered within this chapter.
Survey managers
The survey manager is responsible for the management of the survey. He or she is usually a senior expert with extensive experience of participating in multiple phases of multiple surveys. The survey manager ensures that the objectives, budget and schedule are respected. The survey manager is usually responsible for determining the required resources for the survey, developing a preliminary plan, coordinating the preparation, preparing the budget and monitoring resource utilisation and progress. The survey manager presides over team meetings and should understand and represent the interests of the users. The survey manager liaises with and reports progress to senior management and the client. He or she ensures adherence to legal and regulatory commitments and departmental policies, standards, guidelines and regulations.
The survey manager should be an excellent organizer, with substantial personal authority, that has a deep understanding of the main survey processes.
Survey managers usually come from their respective subject matter units, but sometimes a methodologist or IT specialist can also perform the tasks of the survey manager. Interpersonal and organizational skills should be the main selection criteria for the task of the survey manager, but subject matter knowledge and understanding of processes should not be overlooked, as gaps in those areas may undermine the authority and cause significant problems in survey implementation.
Subject matter specialists
The subject matter specialist is responsible for the content of the survey. He or she conducts or co-ordinates the preparation of definitions and concepts, questionnaire development and testing, preparation of data collection and processing specifications, design of statistical outputs, development and implementation of data analysis and preparation of analytical texts. He or she also co-ordinates the validation of survey results and provides subject matter expertise for the evaluation of data quality and preparation of related documentation.
Subject matter specialists should have a deep understanding of the subject matter and underlying processes required for a reliable response (such as accounting).
He or she should also fully understand survey processes and results, as he or she is responsible for preparing content and its transformation into statistical output. Subject matter specialists should possess advanced analytical knowledge, that will allow them to prepare and interpret results. Further, subject matter specialists should understand the fundamentals required for questionnaire design, know data manipulation and understand basic programming concepts. Understanding of related methodological and IT issues is necessary as it simplifies the cooperation with methodological and IT experts and departments. This often includes knowledge of econometrics (at least basic) and understanding of other data manipulation techniques. Finally, language and data visualisation skills are also valuable as they can increase the quality and understanding of the data presented.
Methodologists
A survey methodologist is responsible for conducting and coordinating the design and development of the statistical methodology to be used for the survey.
He or she is responsible for the sample design, weighting and estimation, quality control design, data quality evaluation designs and measures, the design of edit and imputation mechanisms or strategies, and statistical aspects of data dissemination and analysis.
The survey methodologist also acts as a consultant and adviser to all other survey team members on matters of statistical methodology and ensures adherence to the use of sound and efficient statistical methods.
Survey methodologist should possess advanced statistical knowledge as well as advanced data manipulation knowledge. He or she should understand econometrics (for imputation and modelling) and possess at least intermediate programming skills, as he or she is often forced to write programming code and code modification requests for all aspects of survey processing.
Data collection and follow-up specialists
The data collection specialist is responsible for the development of data collection specifications and procedures. He or she is also responsible for coordinating the recruitment, training, monitoring and control of interviewers and supervisors. His or her responsibilities include developing, implementing, and managing collection operations and preparing material and logistical support. He or she also acts as an adviser to all other members of the survey team on operational matters and ensures the specifications and requirements developed by other team members are properly built into the procedures.
The role of the data collection specialist may include the coordination of field collection through Regional Offices, as well as the implementation of manual and automated operational activities performed at the Head Office.
Processing specialist is responsible for the development of capture and coding specifications and procedures. He or she is also responsible for coordinating the recruitment, training, monitoring and control of the data input, editing and processing staff. His or her responsibilities include the development, implementation and management of capture and coding activities as well as coordination of logistical support related to data processing.
For smaller projects, the role of the data collection and processing specialist may be combined.
Essential skills for both roles are the ability to effectively coordinate a large team, have the organizational authority and the ability to enforce and observe deadlines. Both data collection and processing specialists should have a deep understanding of the data collection process as well as a basic understanding of all previous and following phases, so he/she can propose improvements if necessary.
Interviewers
Survey methods and practices by Statistics Canada lists the following keys to effective interviewing:

Confidence
The interviewer must have confidence in his or her abilities. This is only possible with a good understanding of the survey and the interviewer’s role.

Listening skills
The interviewer should wait for the respondent to finish speaking before they stop listening. The interviewer can indicate that he or she is listening with an occasional ‘I hear you’. However, the interviewer should not make assumptions about what a respondent will say or try to finish a sentence. It is better to ask questions if the interviewer feels that the respondent or the interviewer missed the point.

Empathy
The interviewer should be sensitive to a respondent’s situation at the time of the call or visit. If the respondent describes a personal incident, the interviewer should show interest (but never pass judgment) and then try to refocus the respondent back to the interview.

Speech
Vocal expression is important, and particularly so in telephone interviews. The interviewer should speak very clearly and try to speak at a moderate speed. If the interviewer speaks too quickly, respondents could miss parts of a question. Speaking too slowly causes respondents to begin answering before the interviewer has finished the question. Lowering the head lowers the pitch of the voice. A lower pitch voice is clearer and carries better, particularly on the telephone. The proper speed and pitch should be demonstrated during training.

Know the Questionnaire
The interviewer must know the questionnaire, concepts and terminology used by the survey. There will not be time to look up definitions or answers to questions in the manual during an interview. Nothing breaks the rapport more quickly than long pauses, especially in telephone interviews.
Data Entry and Editing Clerks
Even though modernisation of statistical processes has reduced the need for manual editing, this activity is still necessary as it significantly increases the quality of official statistics. Data entry and manual editing are often performed by personnel without higher education, but significant benefits can be achieved through education and specialisation. A common skill needed in both data entry and editing is high levels of concentration, as the tasks are repetitive, and workers need to spend a lot of time on the same task. This kind of job, therefore, requires a very high level of concentration and patience. Lack of this attribute may lead to poor quality of results. Data entry, but also editing clerks are expected to have exceptional typing speed as they will have to input and check huge amounts of data in a very short time. They need to be comfortable with all forms of data entry devices and be comfortable using a mouse, keyboard, scanners, etc. It is also important that they are versed with the use of basic software such as word processing and spreadsheets, but they must also be accustomed to using the specialised data entry and editing software, and hence basic computer usage knowledge is a must.